

The Fed Pauses, Plus William O'Neil and the CAN SLIM Strategy
by Charles Rotblut | June 15, 2023
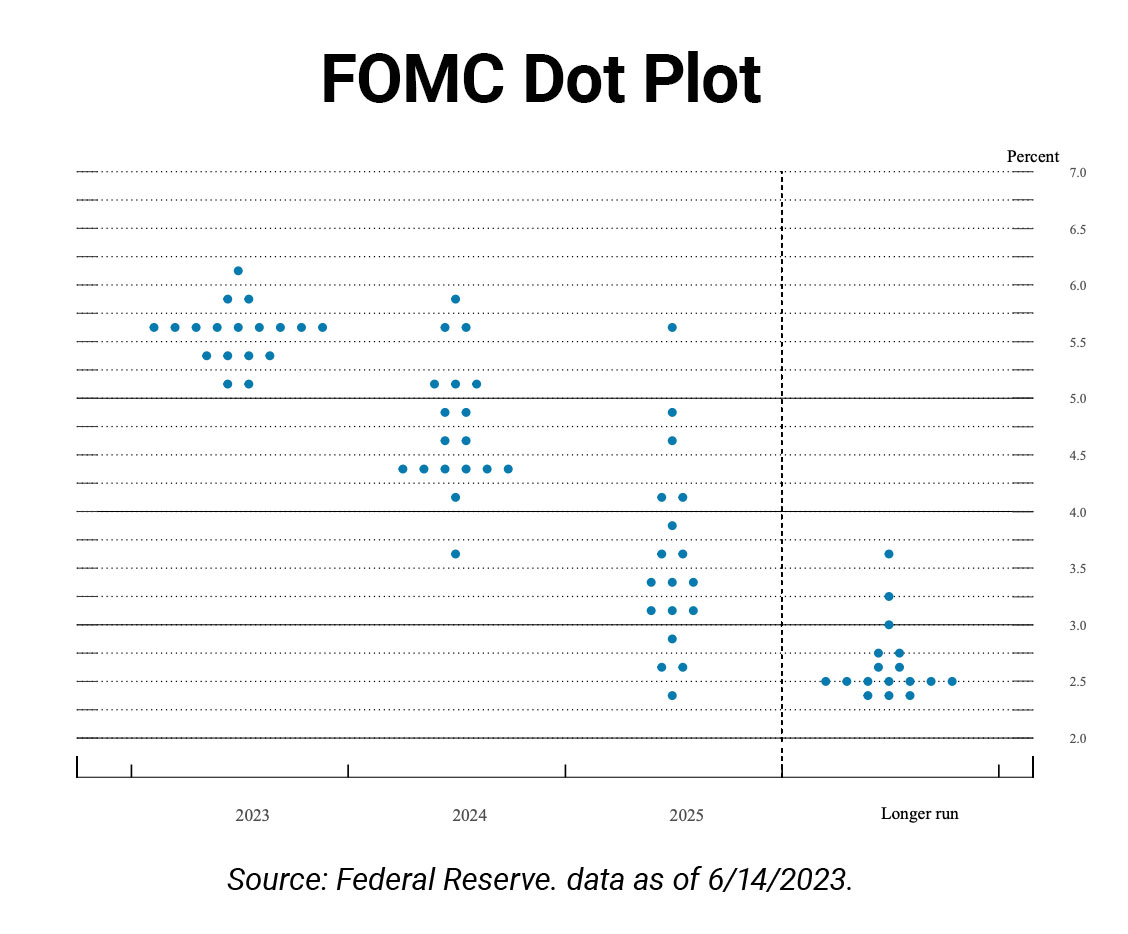
Yesterday, as most of you know, the Federal Open Market Committee (FOMC) kept interest rates unchanged. It was the first time that interest rates haven’t been raised in 11 meetings.
The so-called dot plot, which graphs committee members’ expectations of future interest rates, suggests that yesterday was a pause and not a halting of rate hikes. The majority of committee members expect the target range for rates to be at least 5.50% to 5.75% by year-end. This is 50 basis points (bps) higher than the current range of 5.00% to 5.25%.
As of this afternoon, the futures traders were pricing in a 67% probability of a quarter-point interest rate hike (0.25%) being made at the July meeting according to the CME FedWatch Tool. Traders are not pricing in a second interest rate hike occurring later this year. As always, those odds are very much subject to change.
O’Neil’s Strategy and the AAII Screens Based on It
As I mentioned in last week’s Investor Update, William O’Neil died on May 28, 2023. He was 90 years old.
O’Neil had a long career in finance. He started as a broker with Hayden, Stone and Co. in 1958. He went on to start his own firm, William O’Neil + Co., then Daily Graphs in 1972—the precursor to what is today MarketSmith—and Investor’s Business Daily (IBD) in 1984.

O’Neil’s first article for the AAII Journal was published in April 1999 (Growth Stock Selection: Covering All the Analysis Bases). He went on to write five more.
In an obituary, IBD says O’Neil initially studied the investing strategies of other successful investors. Jack Dreyfus, who founded the Dreyfus Fund, was cited as having a particular influence.
O’Neil’s research did not stop there. He went on to analyze the common traits of the biggest stock market winners using decades of data. His goal was to identify what he described as “the key characteristics of winning stocks.” This led O’Neil to come up with what he considered to be “the seven factors that occurred in virtually every major winner.”
Those seven factors became known as CAN SLIM. CAN SLIM is an acronym that stands for:
- C = Current quarterly earnings: Strong quarter-over-quarter growth
- A = Annual earnings increases: Strong and ongoing year-over-year growth
- N = New products, new management, new highs: Product innovation and new highs for the stock price
- S = Supply and demand: A reasonable number of shares traded and higher volume on upward stock price moves
- L = Leader or laggard: Industry and market leaders
- I = Institutional sponsorship: Institutional investors are active in the stock
- M = Market direction: The stock market’s trend is positive
Over the years, there have been some tweaks made to the specific requirements underlying each of these traits. O’Neil suggested seeking quarter-over-quarter earnings per share growth of 18% to 20% in his 1999 AAII Journal article. Earlier this year, IBD published an article calling for growth of at least 25%. Even with such tweaks, the underlying philosophy of CAN SLIM has not changed.
AAII has three O’Neil stock screens reflecting our interpretation of his strategy. The first one is based on the second edition of his book, “How to Make Money in Stocks: A Winning System in Good Times and Bad” (McGraw Hill, 1995). Our O’Neil’s CAN SLIM screen has the fourth-best return since inception of all AAII Stock Screens. Its annual price gain since 1999 is 19.2%. (The AAII Stock Screens’ returns assume a one-month holding period and exclude dividends and transaction costs.)
Currently, no stocks are passing O’Neil’s CAN SLIM screen. On an average month, just one stock passes the screen. This is due to the restrictive nature of the CAN SLIM criteria. CAN SLIM sets a high bar for a stock to qualify.
We created O’Neil’s CAN SLIM No Float screen to identify more stocks. It removed the requirement for a stock’s float to be no higher than 20 million shares. (Float is the number of shares available for trading, defined as shares outstanding minus shares held by management. O’Neil did not explicitly lay out a float requirement in his original book.) This screen is still restrictive, however, with a monthly average of just three stocks passing.
During turbulent periods for the stock market and/or periods with poor earnings growth, few to no stocks will qualify under the CAN SLIM strategy.
O’Neil’s books and research have had a lasting impact. I’ve met many AAII members and other individual investors who incorporate CAN SLIM into their approaches. O’Neil also inspired others in the industry, including investment professional Marc Reinganum. Reinganum’s use of O’Neil’s insights served as the basis of AAII’s Stock Market Winners screen. This screen’s average annual price gain since inception of 14.1% ranks 12th out of all the AAII Stock Screens.
Special note: The U.S. financial markets, and our office, will be closed on Monday in observance of Juneteenth.

-
O’Neil’s CAN SLIM Screen
AAII’s original screen based on O’Neil’s CAN SLIM approach identifies growth companies using a combination of fundamental and technical factors. -
Stock Market Winners Screen
Our screen based on Marc Reinganum’s use of O’Neil’s “stock market winners” insights has gained 14.1% since inception in 1999. -
AAII’s Screen Power Rankings
See a daily ranking of AAII’s 60+ stock screens based on performance or risk over different time frames. -
Incorporating Equal-Weighted Funds Into Your Allocation
Equal-weighted funds hold the same securities as similar market-cap-weighted funds but in different proportions, reducing stock-specific risk. -
Using PRISM to Conduct Your Midyear Review: Adapt and Thrive in Ever-Changing Market Cycles
The midyear mark is the perfect time for AAII members to take stock of their financial well-being and stay in touch with chapters.
Members are looking for your input. Can you help with this question from the Mutual Funds & ETFs Community?
“In the past, have you invested in residential or nonresidential real estate markets through real estate funds? If so, could you discuss the differences you’ve encountered in terms of performance, risk and market trends? How do you make the decision between investing in residential versus nonresidential real estate?”
Tap the button and then choose the Join the Community button on the right to answer this question in the AAII Community
Answer This Question in the AAII Community »
AAII Sentiment Survey
Optimism slightly increased and remains above average for the second consecutive week in the latest AAII Sentiment Survey. Neutral sentiment increased, while bearish sentiment decreased to its lowest level since July 2021.
Bullish sentiment, expectations that stock prices will rise over the next six months, increased 0.6 percentage points to 45.2%. This puts optimism above its historical average of 37.5% for the second consecutive week. Bullish sentiment was last higher on November 11, 2021 (48.0%).
Neutral sentiment, expectations that stock prices will stay essentially unchanged over the next six months, increased 1.0 percentage points to 32.1%. Neutral sentiment is below its historical average of 31.5% for the fifth time out of the past 24 weeks.
Bearish sentiment, expectations that stock prices will fall over the next six months, decreased 1.6 percentage points to 22.7%. Bearish sentiment was last lower on July 1, 2021 (22.2%).
The bull-bear spread (bullish minus bearish sentiment) increased to 22.5%, up 2.2 percentage points. The bull-bear spread is at its highest level since November 11, 2021 (24.0%).
This week’s special question asked AAII members which factor is most influencing their six-month outlook for stocks. Here are the responses:
- The economy and/or inflation: 41.3%
- Monetary policy/interest rates: 21.5%
- The rebound in the S&P 500 index and the Nasdaq composite: 17.6%
- Corporate earnings: 12.9%
- Other: 6.5%
Bullish: 45.2%, up 0.6 points
Neutral: 32.1%, up 1.0 points
Bearish: 22.7%, down 1.6 points
Bullish: 37.5%
Neutral: 31.5%
Bearish: 31.0%
See more Sentiment Survey results.

June 8, 2023 A New Look for AAII.com, Plus Remembering William O'Neil
June 1, 2023 When Inflation Has Outpaced Both Stocks and Bonds
May 25, 2023 VIX Trading Strategies (In Case Stocks Become More Volatile)
May 18, 2023 May Charts of Interest: Is the Fed Done Raising Rates?

Discussion
Barry from TX posted over 3 years ago:
Charles, what a provocative juxtaposition of economic and market views you have contrasted in this article. The ultimate group of PASSIVE market observers - the highly academic and highly bureaucratic FOMC - continue their always tardy, trial-and-error-prone approach to "manage" inflation by voting on where inflation is headed versus the champion of independent investors - William O'Neil - the long-time market observer who recommends ACTIVELY collecting data to manage market investments using a balance of fundamental "value" analysis (CAN) and technical "price moment" analysis (SLIM) that is so effective that there are currently NO stocks that qualify as good investments. These two disparate approaches arrive at the same nexus: we are in perilous economic and investing times. And the AAII sentiment survey data also disagree on which fork in the road to take.
You need to log in as a registered AAII user before commenting.
Create an account