

When Inflation Has Outpaced Both Stocks and Bonds
by Charles Rotblut | June 01, 2023
Confidence about having enough money to live comfortably throughout retirement fell nine percentage points to 64% in the latest Retirement Confidence Survey. The last time a drop of this magnitude occurred was in 2008.
Inflation was a big contributor to the drop in confidence. According to the Employee Benefit Research Institute (EBRI), 29% of workers and 42% of retirees cited inflation as “the reason for their lack of confidence.” This isn’t surprising given last year’s jump in prices and the drops both stocks and bonds incurred.
While inflation makes for a good song, it erodes our purchasing power—meaning our ability to buy goods and services with the dollars we have. A dollar today certainly doesn’t buy as much as it did just a few years ago as you well know. This is why we need our long-term savings to grow faster than the rate of inflation.
 Equities have historically been the best inflation fighters. Large-cap stocks have realized an annualized return of 10.1% between 1926 and 2022. The 2023 Ibbotson “Stocks, Bonds, Bills, and Inflation” (SBBI) Yearbook shows small-cap stocks performing even better, with an annualized return of 11.8%.
Bonds have fared decently against inflation. Long-term and intermediate-term bonds have returned 5.2% and 4.9%, respectively, on an annualized basis between 1926 and 2022. Inflation, meanwhile, has risen at an annualized rate of 2.9% over the same period.
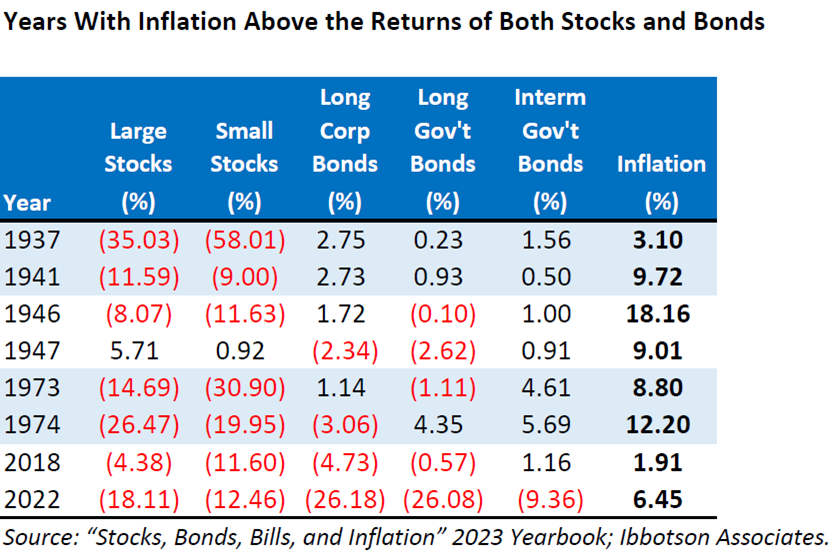
There have been some years when inflation was higher than the returns of both stocks and bonds—eight specifically since 1926. Last year was one of those eight. The SBBI Yearbook lists inflation as having risen by 6.45% in 2022. Out of the aforementioned investment options, intermediate-term government bonds fared best in 2022, with a decline of 9.36%.
The other seven years were 1937, 1941, 1946, 1947, 1973, 1974 and 2018. Two of those years, 1937 and 2018, had average-to-low levels of inflation (3.10% and 1.91%, respectively) but negative returns for stocks (especially 1937) and lackluster returns for bonds (particularly in 2018 when the Federal Reserve reduced its balance sheet). Inflation jumped in 1941 to 9.72% as the U.S. economy was emerging from the Great Depression and the U.S. became entangled in World War II. The lifting of price controls, supply shocks and the post-war jump in demand led to the high inflation of 1946 and 1947 (18.16% and 9.01%, respectively). An increase in food prices, the oil embargo and the end of wage-price controls sent prices flying in 1973 and 1974 (inflation of 8.80% and 12.20%, respectively). We certainly saw the impact of supply chain problems and the transition to post-pandemic lifestyles on prices in 2022 (inflation of 6.45%).
Having eight years with inflation higher than the returns on stocks and bonds also means that there were 89 years out of the last 97 years when either stocks or bonds fared better than inflation. Both stocks and bonds beat inflation during 24 of those of years. While this is not a guarantee of what will happen in the future, the historical data does provide favorable odds for using a diversified portfolio to fend off the eroding impacts of inflation.
As far as dealing with inflation, the two additional base strategies depend on whether you are in the accumulation (saving) stage or the withdrawal stage.
Those who have long investing time horizons should consider using allocation approaches that are mostly (or entirely) focused on equities. Stocks have the best odds of beating inflation due to their higher returns and greater frequency of having the best annual gains. If you can, saving more will also help. (Saving more also works in a low-inflation environment.)
Retirees and others who are taking withdrawals should be aware that withdrawal strategies like the 4% rule tend to fail when inflation is high. Such strategies also struggle when bear markets occur during approximately the first 10 years of retirement. Maintaining some allocation to cash (to avoid selling stocks in down markets), being able to cut back on your spending (or at least not increase it) and taking a flexible approach to how much you withdraw can help significantly.

-
Tips About Treasury Inflation-Protected Securities
TIPS can be useful in protecting against unanticipated inflation, although they do not eliminate interest rate risk entirely. -
I Bond Yields Are Down From Their Peak
How composite rates for Series I bonds issued within the last five years have evolved. -
Dividend Growth Helps Portfolios Combat Inflation
Investors, particularly retirees, can leverage the benefits of dividends to combat the deleterious effects of inflation and market volatility. -
Turmoil in the Robo-Advice Industry, Plus the Best Robo Platforms
A look back at the digital advice industry and an update on current robo products and performance. -
Member News 2023
Read about the latest enhancements to the AAII Community and improvements coming soon to AAII.com. Plus, see our annual financial summary and academic research awards.
Members are looking for your input. Can you help with this question from the Retirement Withdrawals Community?
“In a recent AAII Journal article, we discussed the rules regarding retirement account rollovers. If you’ve done a rollover before, what factors influenced your decision?”
Tap the button and then choose the Join the Community button on the right to answer this question in the AAII Community
Answer This Question in the AAII Community »
AAII Sentiment Survey
Pessimism decreased but continued its streak of above-average readings in the latest AAII Sentiment Survey. Neutral sentiment and bullish sentiment rose.
Bullish sentiment, expectations that stock prices will rise over the next six months, increased 1.7 percentage points to 29.1%. This keeps optimism within its typical range for just the fourth time in the last 15 weeks. Nonetheless, bullish sentiment remains below its historical average of 37.5% for the 78th time out of the last 80 weeks.
Neutral sentiment, expectations that stock prices will stay essentially unchanged over the next six months, increased 1.2 percentage points to 34.1%. Neutral sentiment is above its historical average of 31.5% for the 19th time out of the last 22 weeks.
Bearish sentiment, expectations that stock prices will fall over the next six months, decreased 2.9 percentage points to 36.8%. Bearish sentiment is above its historical average of 31.0% for the 75th time out of the past 80 weeks.
The bull-bear spread (bullish minus bearish sentiment) increased to –7.8% after being unusually low for the last five weeks.
This week’s special question asked AAII members how they would describe the current state of the economy. Here are the responses:
- Strong: 6.3%
- Mixed with areas of strength and weaknesses: 72.8%
- Weak: 18.1%
- Not sure/No opinion: 2.0%
Bullish: 29.1%, up 1.7 points
Neutral: 34.1%, up 1.2 points
Bearish: 36.8%, down 2.9 points
Bullish: 37.5%
Neutral: 31.5%
Bearish: 31.0%
See more Sentiment Survey results.

AAII Asset Allocation Survey
Individual investors’ exposure to fixed income pulled back in May, retreating from its 26-month high set in April 2023. The May AAII Asset Allocation Survey also shows slightly higher equity allocations and a small change in cash allocations.
Stock and stock fund allocations increased by 0.9 percentage points to 65.2%. The increase keeps stock and stock fund allocations above their historical average of 61.5% for the 36th consecutive month.
Bond and bond fund allocations decreased by 0.9 percentage points to 14.8%. May was the 27th consecutive month with fixed-income allocations below their historical average of 16.0%.
Cash allocations increased by a modest 0.1 percentage points to 20.0%. Cash allocations are below their historical average of 22.5% for the sixth consecutive month.
Pessimism in the weekly AAII Sentiment Survey pulled back from unusually high levels during the second half of May. Large-cap stocks—particularly large-cap growth—fared well during May. The gains in equity were not widespread, however, as mid-cap, small-cap and value stocks all declined.
- Stocks and Stock Funds: 65.2%, up 0.9 percentage points
- Bonds and Bond Funds: 14.8%, down 0.9 percentage points
- Cash: 20.0%, up 0.1 percentage points
- Stocks: 33.6%, up 3.1 percentage points
- Stocks Funds: 31.6%, down 2.3 percentage points
- Bonds: 4.3%, down 0.6 percentage points
- Bond Funds: 10.6%, down 0.3 percentage points
- Stocks/Stock Funds: 62.0%
- Bonds/Bond Funds: 16.0%
- Cash: 22.0%
Take the Asset Allocation Survey.
May 25, 2023 VIX Trading Strategies (In Case Stocks Become More Volatile)
May 18, 2023 May Charts of Interest: Is the Fed Done Raising Rates?
May 11, 2023 Continue to Hold I Bonds or Sell Them?
May 4, 2023 Setting Aside Self-Doubt When It Comes to Allocation

Discussion
Steve H from IN posted over 3 years ago:
Well, maybe not a good song, ha, ha, but relevant anyhow.
John L from NJ posted over 3 years ago:
Over the long term, stocks are a perfect hedge against inflation. But in the short term, stocks have bad years. Generally after incredibly good years like 2020 and 2021 which occurred at the end of the large bull market run that started in 2009. Strange how everyone forgets that in the long run stocks have returned about 10% and after years of better than average return; valuations become too high and the market has a tendency to mean revert. Over due stock market mean reversion in 2022 coupled with high inflation caused by government covid spending and dreadfully poor monetary policy by the Federal Reserve and we get the myopic commentary above. It isn't high inflation that causes the 4% rule to fail; it is blindly following this simple rule when starting retirement during a period when stock market valuations are extremely high. My guess is that the 4% rule could work for those who retired at the end of 2021. Year end valuation levels in 1968 and 1964 were similar to 2021 and the 4% rule worked then. However, 3% would be more appropriate given the high year end valuation.
Barry from TX posted over 3 years ago:
Inflation is a "squishy" topic. This time, inflation may be different - as the Fed has recently "discovered" (similar to Columbus) after 14 months of "trial and error" reasoning based on outdated assumptions about the relationship between employment and inflation. In 2023, more employers than in the past are hanging on to employees (fewer layoffs) because the "employable" job market is so thin (lower skills, less interest, more largess) and they don't believe they can replace current employees with similar skills in this job market. This cause-and-effect process increases the number of hours employee work relative to the dollar value of the total output they produce. These choices produce LOWER productivity and HIGHER inflation at the same time. This leads to employers raising prices to offset lower productivity to maintain operating margins, a key metric in most approaches to fundamental analysis that seek to find value and growth stocks. The net effect of this "doom spiral" is inflation keeps rising despite Fed interest rate raises. The Fed fell into this trap because they were trying to get a "two-fer." The Fed has a "dual mandate" under law. #1 Keep inflation under 2% (it is currently at 4%) and #2 Maintain "full" employment (measured by unemployment under 3%. They are missing here, too.). They have failed to achieve both to date. The outlook is not good. The only two tools the Fed has except "jawboning" from the podium) are: #1 Raise the Fed Funds Rate, and #2 Sell the U. S. Government bonds and mortgage-backed securities (MBS) on their balance sheet. They have been doing both right now -- FASTER than EVER before since WWII. If Chairman Powell is the "pilot" and the economy is the "aircraft," his "angle of descent" glide path vector is getting steeper and he is "running out of runway" to land this aircraft without heroic emergency measures.
You need to log in as a registered AAII user before commenting.
Create an account