

Setting Aside Self-Doubt When It Comes to Allocation
by Charles Rotblut | May 04, 2023
Featured Tickers: VFIAX
VFIDX
VFSAX
VGSLX
VSIAX
VFIAX
VFIDX
VFSAX
VGSLX
VSIAX
Despite the volatility that the financial markets have seen over the past 16 months, my 403(b) account’s allocation remains close to target. None of the asset class groups I’m allocated to are significantly overweighted or underweighted. Here is the allocation breakdown as of the end of April:
• Vanguard 500 Index Admiral fund  (VFIAX): 22%
• Vanguard Small-Cap Value Index Admiral fund (VSIAX): 20%
• Vanguard FTSE All-World ex-US Small-Cap Index Admiral fund (VFSAX): 19%
• Vanguard Real Estate Index Admiral fund (VGSLX): 20%
• Vanguard Intermediate-Term Investment-Grade Admiral fund (VFIDX): 19%
As much as I’d like to celebrate not having to rebalance, the reality is that this is because stocks, bonds and real estate investment trusts (REITs) struggled last year and have yet to significantly recover. One-year returns, through the end of March 2023, were negative for all five funds. (End of April data was not yet available when I wrote this week’s commentary.)
Vanguard founder John Bogle explained his allocation of 50% stocks and 50% bonds by saying that he spent half of his time worrying about not having enough exposure to stocks and the other half worrying about having too much exposure to stocks.
While I have far less allocated to bonds, I’ll admit to finding myself in the self-doubting camp from time to time. The return numbers over the last 10 years clearly show that I would have been better off having my 403(b) account completely allocated to large-cap stocks.
How do I not succumb to self-doubt or regret about what would have been the optimal allocation to follow? First, I remind myself that it is always easier to be the Monday morning quarterback than it is to be the guy on Sunday coping with seemingly never-ending blitzes.
Second, I keep going back to the long-term data. While 10 years can feel like a long period of time, it’s not very long in the scope of investing. Shorter-term events can drive 10-year returns. Over longer periods of time, older relationships tend to hold up with absolute and relative returns reverting to their mean.
Consider this data from the “Stocks, Bonds, Bills, and Inflation” 2023 Ibbotson Yearbook. Below are the annualized returns and volatility for each asset class group for the period of 1972–2022, a period of 51 years.
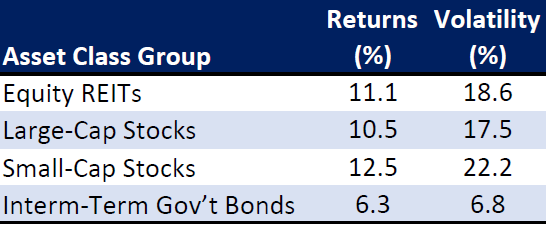
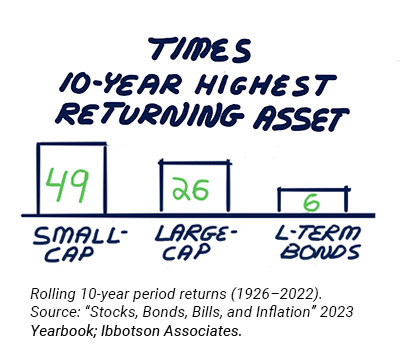
As you can see, large-cap stocks haven’t been the best performers over the long term. Even at comparatively shorter rolling periods of 10 years, their leadership hasn’t been consistent.
Between 1926 and 2022, small-cap stocks have had the highest 10-year returns 49 times (out of a mix of large- and small-cap stocks, intermediate- and long-term government bonds, long-term corporate bonds, Treasury bills and inflation). Large-cap stocks have only had the highest returns 26 times out of those 88 rolling periods. Long-term government bonds rank third, being the winner during six of those rolling periods.
There is also a diversification aspect at play. REITs have reduced correlations with large-cap stocks (0.59) and long-term corporate bonds (0.33). Long-term corporate bonds have very low correlations with small-cap stocks (0.16) and large-cap stocks (0.33). Intermediate-term government bonds are even less correlated with stocks. Correlations between domestic and foreign stocks ebb and flow but diversification benefits still exist. (Correlations range from –1.0 when two assets’ returns are the inverse of each other to 1.0 for returns that are similar. A correlation of 0.0 implies that two assets’ returns are independent of one another.)
I rely on the historical data because, as Yogi Berra put it, “It’s tough to make predictions, especially about the future.” While there is never a guarantee that historical trends and relationships will continue into the future, at least I can sleep at night knowing that I relied on data and not hunches for my allocation.

-
Rebalancing to Navigate Bear Markets and Sequence Risk
Periodically adjusting allocations back to intended targets lessens the magnitude of swings in a portfolio’s returns. -
Asset Class Group Returns: Short-Term Bonds Lead During a Rough Year
The year 2022 was a tough one for asset allocators as returns were down across the board. -
Growth and Technology Mutual Funds and ETFs Exert Muscle in First Quarter
The first quarter of 2023 arguably left investors with whiplash, from March’s banking havoc to vast changes in expectations about the Federal Reserve’s next policy moves. -
Lift off With Rising Dividend-Paying Stocks
Rising dividend-paying stocks have historically provided higher cumulative returns with lower levels of volatility than non-dividend-paying stocks over long-term holding periods. -
Unlock the Power of Customization on AAII.com
By tailoring your AAII.com experience to your personal preferences, you can have the resources that are most relevant and valuable to you right at your fingertips.
Members are looking for your input. Can you help with this question from the Technical Analysis Community?
“In the most recent AAII Journal issue, Raymond Rondeau explains the relationship between volume, liquidity and conviction in order to effectively evaluate a price move’s relevancy, trend strength and probable direction. I’m curious to hear other people’s thoughts and suggestions on using volume and conviction to predict price trends and direction.”
Tap the button and then choose the Join the Community button on the right to answer this question in the AAII Community
Answer This Question in the AAII Community »
AAII Sentiment Survey
Pessimism among individual investors stayed above average for the 11th consecutive week in the latest AAII Sentiment Survey. Neutral sentiment decreased, as did optimism.
Bullish sentiment, expectations that stock prices will rise over the next six months, decreased 0.1 percentage points to 24.1%. Optimism continues to be at an unusually low level. Bullish sentiment is unusually low for the 50th time out of the past 70 weeks.
Neutral sentiment, expectations that stock prices will stay essentially unchanged over the next six months, decreased 6.3 percentage points to 31.0%. This ended neutral sentiment’s five-week streak of above-average levels, and it is below average for just the second time in 18 weeks.
Bearish sentiment, expectations that stock prices will fall over the next six months, jumped 6.4 percentage points to 44.9%. Bearish sentiment is still above its historical average of 31.0% for the 71st time out of the past 76 weeks. Additionally, bearish sentiment is at a five-week high.
The bull-bear spread (bullish minus bearish sentiment) decreased 6.4 percentage points to –20.8%. The bull-bear spread remains at an unusually low level for the eighth time out of the last 11 weeks.
This week’s responses were recorded prior to the 0.25% interest rate increase by the Federal Open Market Committee (FOMC).
This week’s special question asked AAII members which asset class they think will provide the highest return over the next six months. Here are their responses:
- Domestic stocks: 39.6%
- Bonds: 13.0%
- Gold: 9.0%
- Money market funds: 27.1%
- No opinion/Not sure: 10.7%
Bullish: 24.1%, down 0.1 points
Neutral: 31.0%, down 6.3 points
Bearish: 44.9%, up 6.4 points
Bullish: 37.5%
Neutral: 31.5%
Bearish: 31.0%
See more Sentiment Survey results.

AAII Asset Allocation Survey
Individual investors’ exposure to fixed income rose to a 26-month high last month. The April AAII Asset Allocation Survey also shows slightly lower equity allocations and approximately the same cash allocations.
Stock and stock fund allocations fell slightly by 0.4 percentage points to 64.3%. This second consecutive monthly decline follows four straight months of rising equity exposure. Nonetheless, stock and stock fund allocations are above their historical average of 61.5% for the 35th consecutive month.
Bond and bond fund allocations rose 0.6 percentage points to 15.7%. Fixed-income exposure was last higher in February 2021 at 16.0%. Bond and bond fund allocations are below their historical average of 16.0% for the 26th consecutive month.
Cash allocations fell by 0.2 percentage points to 19.9%. Cash allocations are below their historical average of 22.5% for the fifth consecutive month.
The fixed-income allocations increased as Treasury bond yields continued to pull back from their recent highs. The decline in equity allocations occurred as optimism in the weekly AAII Sentiment Survey stayed below average for the 11th consecutive week and at an unusually low level for the past three weeks.
- Stocks and Stock Funds: 64.3%, down 0.4 percentage points
- Bonds and Bond Funds: 15.7%, up 0.6 percentage points
- Cash: 19.9%, down 0.2 percentage points
- Stocks: 30.4%, down 0.4 percentage points
- Stocks Funds: 33.9%, up 0.0 percentage points
- Bonds: 4.8%, up 0.6 percentage points
- Bond Funds: 10.9%, down 0.1 percentage points
- Stocks/Stock Funds: 62.0%
- Bonds/Bond Funds: 16.0%
- Cash: 22.0%
Take the Asset Allocation Survey.
April 27, 2023 A Growth Stock or Not? Plus, Other Notes From the Morningstar Investment Conference
April 20, 2023 April Charts of Interest: Don't Jinx It
April 13, 2023 Warning Signs That Companies Are in Big Trouble
April 6, 2023 The Four Types of Risk

Discussion
Lawrence K Fox from WA posted over 3 years ago:
I enjoy reading Charles Rotblut's commentary that appears in my Thursday Inbox. But I believe a correction to 2 of his columns needs to be made. On a couple of occasions, and one being his most recent piece, Charles has attributed this quote to Yogi Berra:: "It’s tough to make predictions, especially about the future.” My understanding it is a dated Danish expression that was made famous by Niels Bohr in one of his arguments or discussions with Einstein. The quote investigator has an interesting discussion of this (https://quoteinvestigator.com/2013/10/20/no-predict/ ). But then again, Yogi was quoted as saying: “I never said most of the things I said”.
Barry from TX posted over 3 years ago:
Kudos Lawrence. I admire anyone who verifies the provenance of the "facts" that they come across. I was hoping to find out that it was really a quote from Yogi, but I (1) went to the main source you listed in our comment, (2) then checked a sample of 10 of the references there (3) by verifying they exist (4) using their web addresses and (4) following links to other sources. That satisfied me that your comment has merit. One key element was that many of the sources were dated BEFORE Yogi's prime. Damn shame. I would have much preferred it was a Yogi quote. The clincher was I couldn't find the quote in the AAII article among the Yogi quotes @https://ftw.usatoday.com/2019/03/the-50-greatest-yogi-berra-quotes. This just proved that it's like Yogi said, "I didn't say half the things I said." That's a made-up Yogi-ism, too. Thanks, Lawrence.
You need to log in as a registered AAII user before commenting.
Create an account