

April Charts of Interest: Don't Jinx It
by Charles Rotblut | April 20, 2023
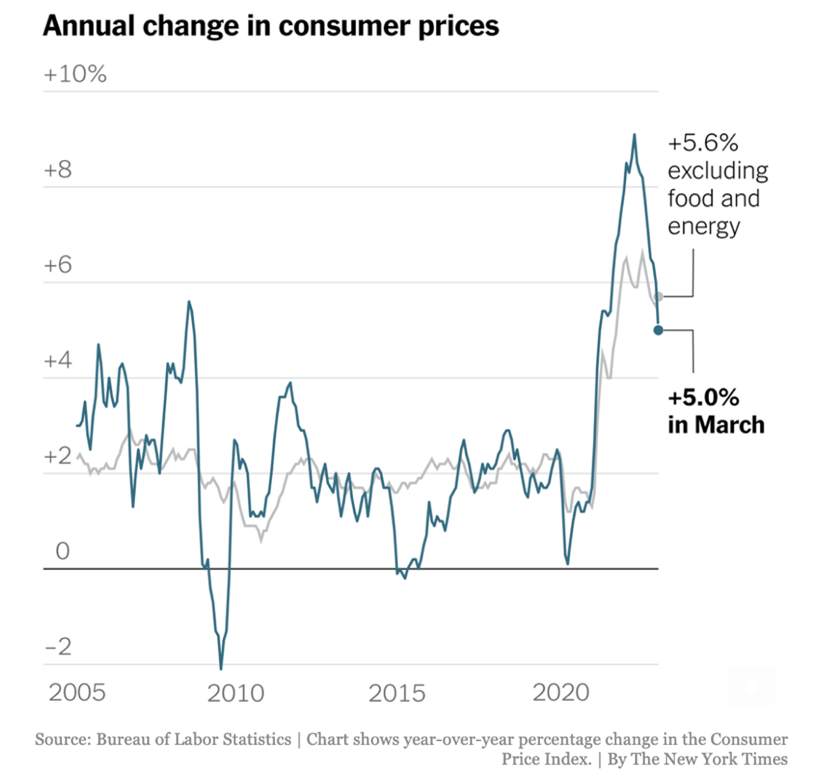
Let’s start this month’s Charts of Interest with the big news from last week: inflation. The consumer price index (CPI) showed signs of having peaked in March. The 12-month change in inflation was the lowest it has been since May 2021, as the chart below from The New York Times shows. The core rate—which excludes food and energy—rose slightly versus February, however. Plus, the monthly numbers can be volatile.
Keep the volatility of the monthly numbers in mind when looking at the chart below. If you’re the superstitious type, I suggest tossing salt over your shoulder if you’re worried about jinxing what many hope is the start of a trend.
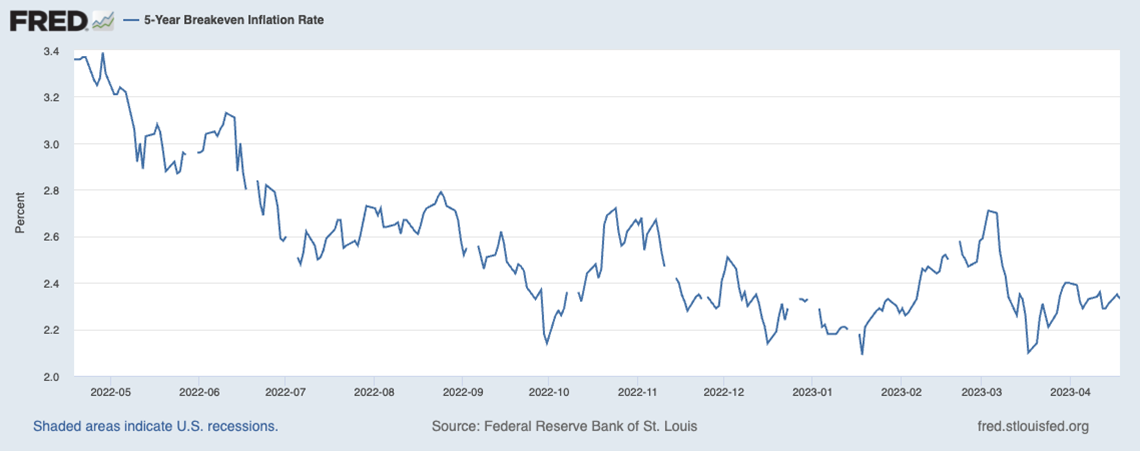
Traders Haven’t Changed Their Inflation Expectations Much
Five-year breakeven rates, which are based on five-year constant maturity Treasury securities and five-year inflation-indexed Treasurys, haven’t changed significantly since last fall. Traders continue to expect the inflation rate to range between approximately 2.1% and 2.7% over the next five years. The good news is that these expectations are well below the levels of inflation we’re seeing right now.
BlackRock: Keep It Short
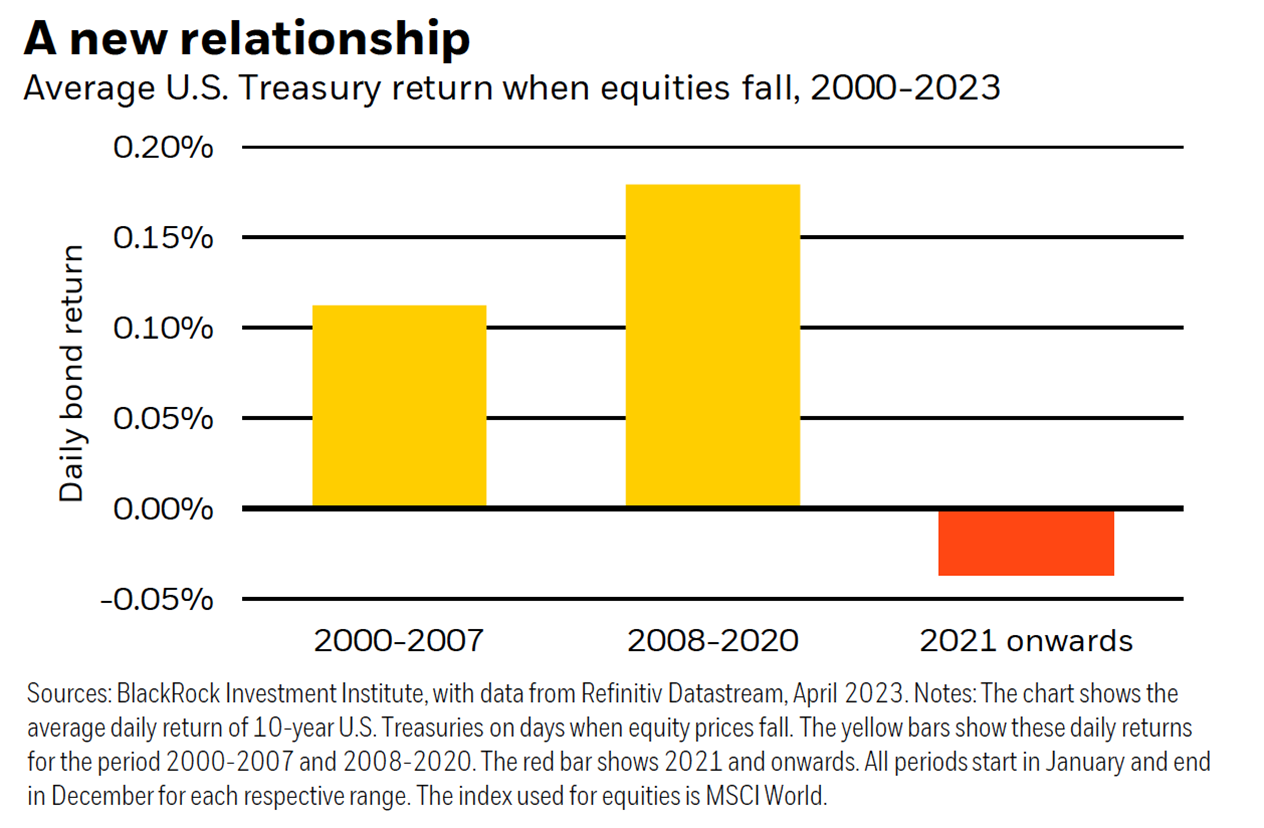
Since inflation made a comeback in 2021, bond funds have failed to provide a ballast against the volatility of equities. This was certainly the case last year.
Strategists at BlackRock believe higher interest rates and more volatility call for a change in how portfolios are allocated. They call for limiting bond maturities to no longer than five years, given central banks’ focus on fighting inflation. Keep in mind that bond bears were routinely wrong between 2009 and 2021, so they don’t have a good track record.
This said, the AAII Asset Allocation Models incorporate intermediate- and short-term bond funds in the moderate and conservative investor models.
The Hot Investment Right Now? Money Market Funds
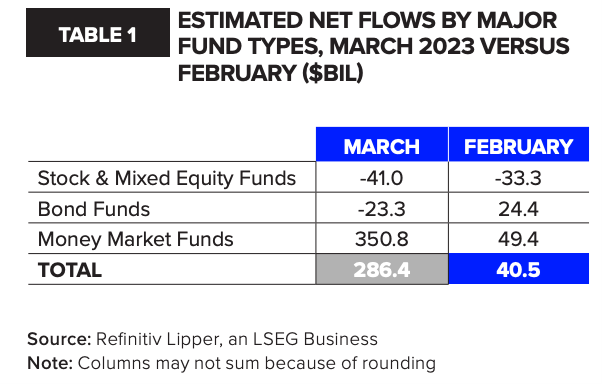
One upside of inflation and rising interest rates is higher yields. Money market funds raked in their “largest monthly net inflows since April 2020” last month. March was also the sixth consecutive month these funds have seen inflows. Refinitiv Lipper credits investors who are seeking safe-haven investments as the reason, though the juicy yields are likely boosting these funds’ appeal.
Small-Caps Are Cheap; Yes, We Really Mean It This Time
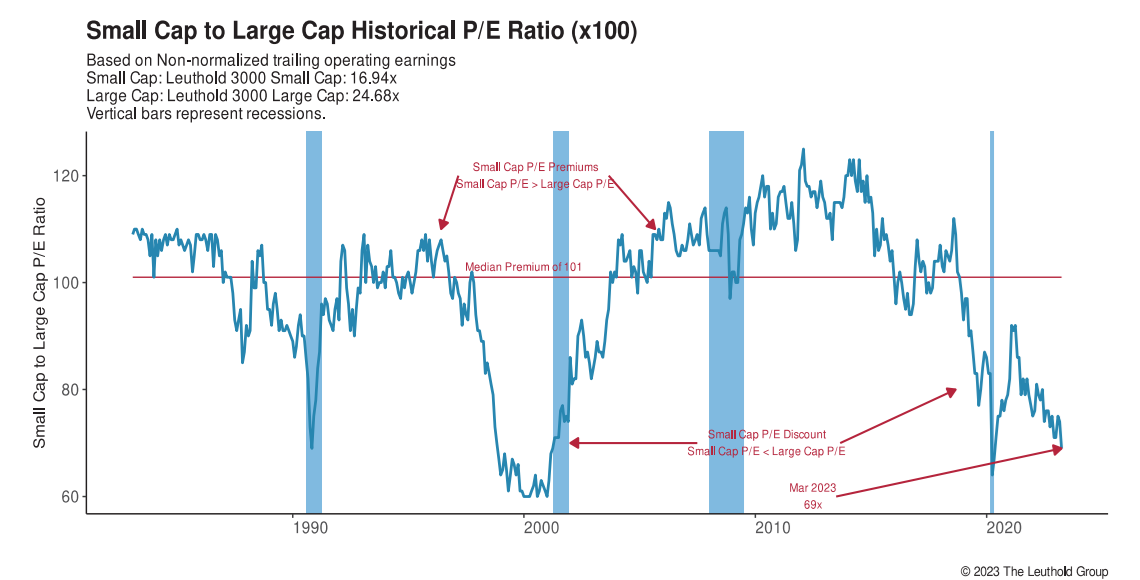
Breaking from the inflation theme is this chart from The Leuthold Group. Small-cap stocks are trading at a 31% discount to large-cap stocks based on non-normalized trailing operating earnings, according to Leuthold. “The huge outperformance for large caps in March sent our ratio of ratios tumbling to its lowest level since the start of the pandemic,” observed the firm.
These types of relationships tend to revert back toward their long-term averages as investors throw in the towel. Leuthold, for its part, gave contrarians a reason for optimism by writing, “This lopsided performance has been dragging on for so long that it’s hard to imagine a reversal in trend.”
Source: The Leuthold Group.
Some Large-Caps Are Expensive, Some Aren’t
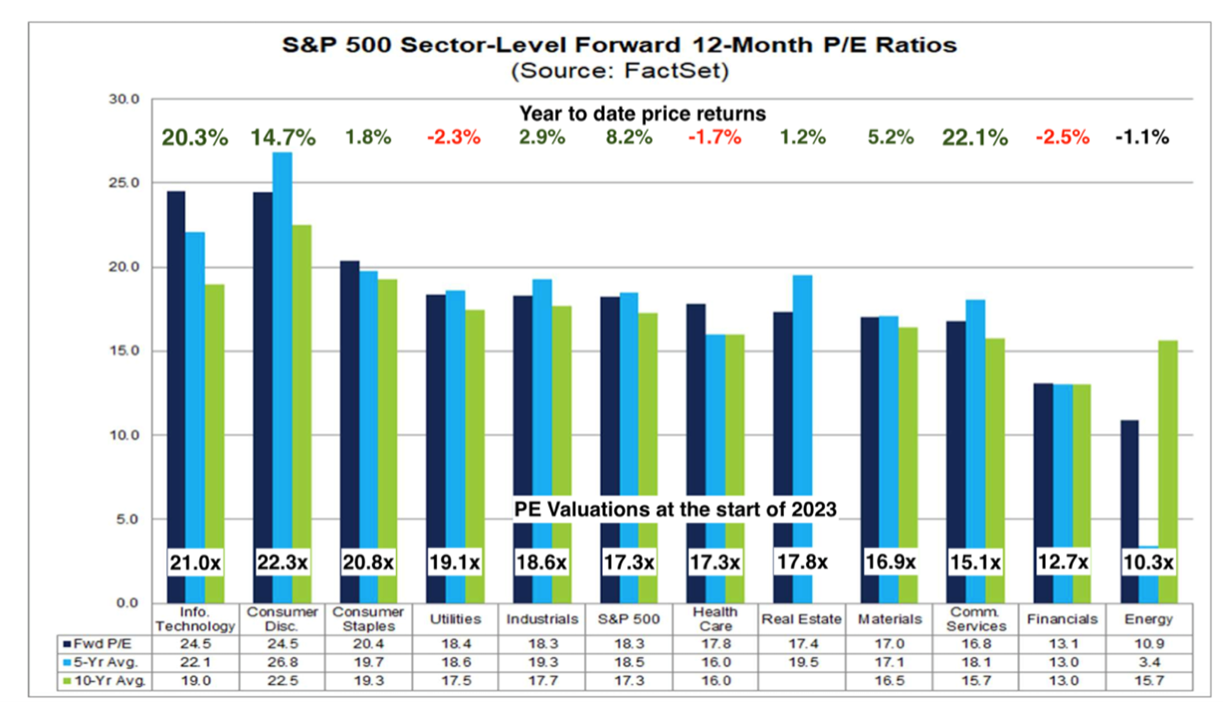
DataTrek sent out a chart showing S&P 500 index sector valuations as of the start of the year. As you can see, some sectors are pricey while others are discounted. Technology, consumer discretionary, consumer staples, utilities and industrials are in the pricey group. The discounted group includes health care, real estate, materials, communication services, financials and energy.
I’ll add that this year’s run-up in the S&P 500 has been driven by technology and technology-related firms. The S&P 500 was up 8.2% year to date as of Tuesday, while the S&P 500 Equal Weight index was up 3.1%. Same stocks, but different weightings.
Source: DataTrek.
No Thanks, I’ll Wait for “Cocaine Bear” to Come to Streaming Platforms
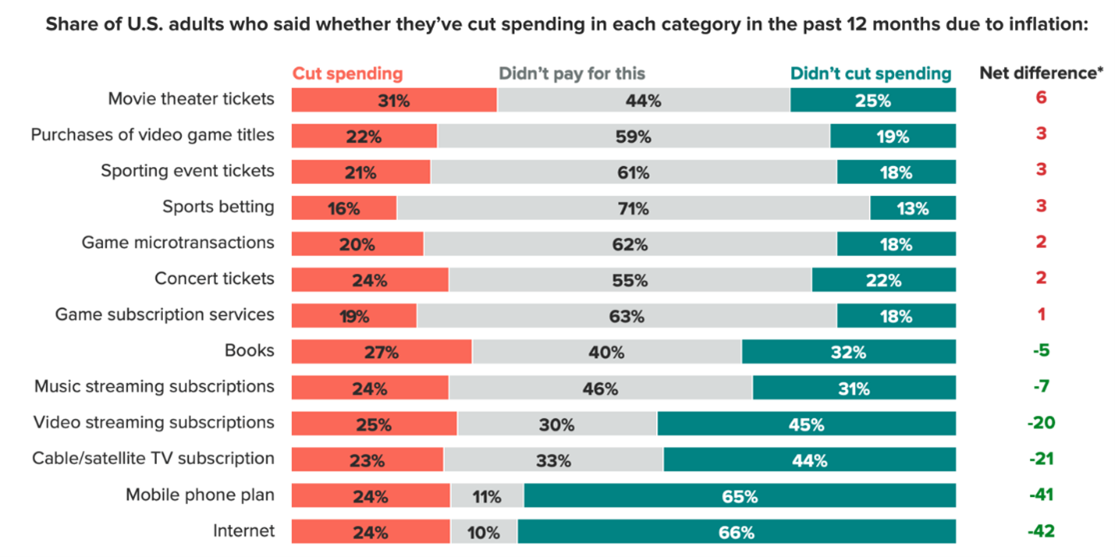
Finally, Morning Consult observed that recreation/entertainment was among the top categories consumers have cut their spending on in response to inflation. As you can see, movie theater tickets topped the list of spending cuts.
You may notice that spending on concert tickets has also declined. This is possibly because concertgoers are being priced out. Last week, my wife asked if I was interested in seeing Queen with Adam Lambert. My response was “yes” until she calculated the cost: approximately $750 for the two of us to sit in upper-level seats! (Don’t even get me started on Ticketmaster.) As much as I enjoy live music and would love to see Queen, that price is way too high.
Source: Morning Consult.

-
Online Exclusive: Understanding the Breakeven Inflation Rate
The breakeven inflation rate is a helpful guide for determining minimal rates of return required to maintain wealth in real terms. -
The Benefits and Risks of Intermediate Bond Funds
Intermediate-term bonds are less sensitive to interest rate changes than long-term bonds and typically provide a greater yield than short-term bonds. -
Investing for a Child’s or Grandchild’s Lifetime
Any plan to help a young family member provide for their future starts with the most important component: time. -
A Glimpse Into How AAII Members Built Their Savings
Tapping into the experience of other investors yields a fountain of wisdom on how to accumulate a nest egg. -
Retirement Plans Add Flexibility to Keep Assets Put After Leaving Work
Nearly three-quarters of defined-contribution plan participants aged 60 and older leave their employer’s plan within five years after separating and roll those assets to an IRA.
Members are looking for your input. Can you help with this question from the Income Investing Community?
“Does anyone here have experience purchasing several municipal bonds directly, not through an ETF or funds? Looking for answers to questions about their tax characteristics such as spreads and credit quality. Do you typically hold to maturity? Thank you!”
Tap the button and then choose the Join the Community button on the right to answer this question in the AAII Community
Answer This Question in the AAII Community »
AAII Sentiment Survey
Pessimism among individual investors remains above average for the ninth consecutive week in the latest AAII Sentiment Survey. Neutral sentiment decreased, while optimism slightly increased.
Bullish sentiment, expectations that stock prices will rise over the next six months, increased 1.2 percentage points to 27.2%. Optimism remains at an unusually low level. Bullish sentiment remains below its historical average of 37.5% for the 72nd time out of the past 74 weeks.
Neutral sentiment, expectations that stock prices will stay essentially unchanged over the next six months, decreased 1.8 percentage points to 37.7%. Neutral sentiment continues to be above its historical average for the 15th time out of the past 16 weeks.
Bearish sentiment, expectations that stock prices will fall over the next six months, increased 0.6 percentage points to 35.1%. After a stretch of unusually high levels, pessimism has been reverting closer to its average for the last three weeks. However, bearish sentiment is still above its historical average of 31.0% for the 69th time out of the past 74 weeks.
The bull-bear spread (bullish minus bearish sentiment) increased 0.5 percentage points to –7.9%. The bull-bear spread remains below average.
Market volatility continues to be a concern for individual investors.
Though individual investors mostly approved of the latest interest rate hike being smaller, inflation, market volatility and the pace of economic growth continue to influence individual investors’ short-term outlook for stocks.
Bullish: 27.2%, up 1.2 points
Neutral: 37.7%, down 1.8 points
Bearish: 35.1%, up 0.6 points
Bullish: 37.5%
Neutral: 31.5%
Bearish: 31.0%
See more Sentiment Survey results.

April 13, 2023 Warning Signs That Companies Are in Big Trouble
April 6, 2023 The Four Types of Risk
March 30, 2023 Remembering AAII's Derek Hageman
March 23, 2023 March Charts of Interest

Discussion
Barry from TX posted over 3 years ago:
Charles, kudos on aligning the choices of charts with trends in the AAII sentiment survey. In contrast, national media and local newscasts are mostly breathless parades of “breaking news” without any attempt to connect these snapshots to overarching trends relevant to viewers. Be careful. You may turn out to be the next Walter Cronkite.
Charles Rotblut from Illinois posted over 3 years ago:
Barry,
I'd be happy to have just a small fraction of Cronkite's oratorical skills.
-Charles
You need to log in as a registered AAII user before commenting.
Create an account