

March Charts of Interest
by Charles Rotblut | March 23, 2023
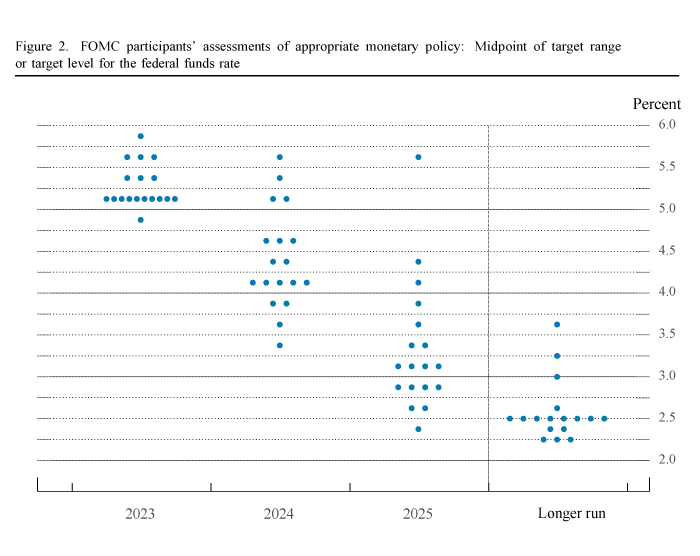
The most appropriate place to start this month’s charts of interest to individual investors is with the Federal Reserve’s “dot plot.” The dot plot displays where each Federal Open Market Committee (FOMC) participant expects interest rates to be the in the future. The chart is updated quarterly.
I chose to lead with the dot plot because yesterday’s 25-basis-point (0.25%) rate hike was smaller than the previous six increases. The last time we saw a quarter-point hike was in March 2022 when the FOMC first started raising rates. That hike initiated the current series of interest rate increases. The FOMC’s new target range is 4.75% to 5.00%.
Take note of the disparity in forecasts. While participants expect rates to fall in 2024 and 2025, they disagree about how much they will fall.
Source: Federal Reserve.
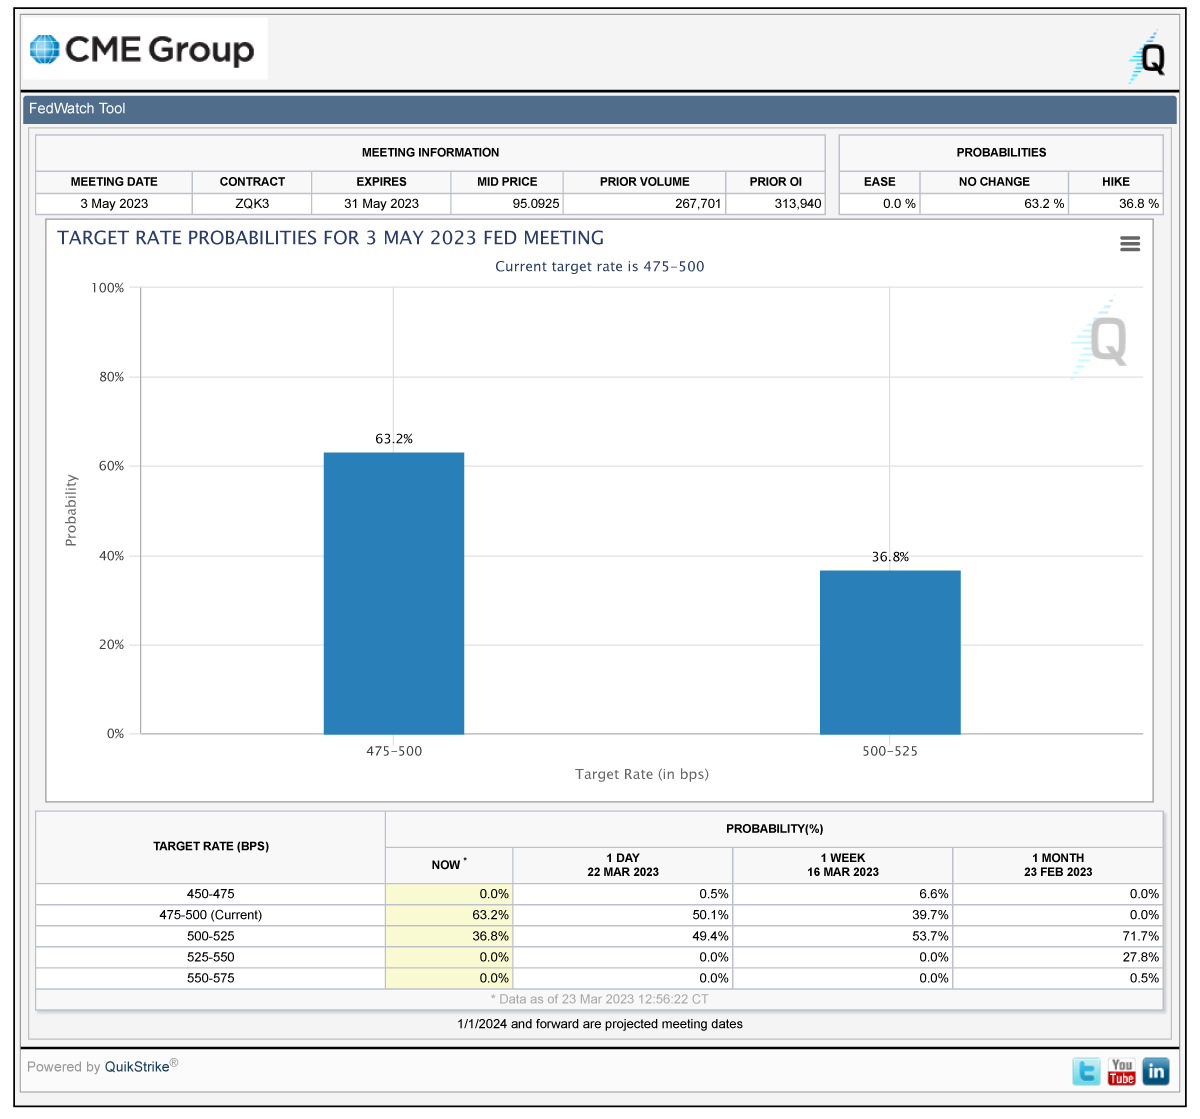
As of this afternoon, traders are leaning toward believing the FOMC will not raise interest rates at its May meeting. The CME’s FedWatch Tool calculates these probabilities based on the price of fed funds futures. The current expectations are very much subject to change.
Source: CME Group.
A Swing and a Miss
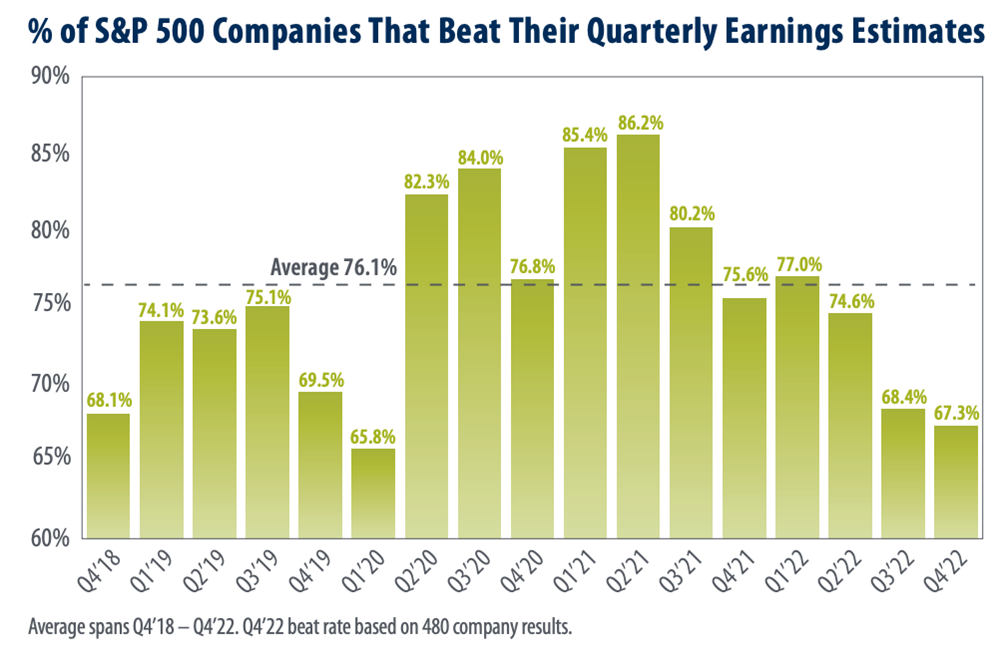
Fourth-quarter earnings season stands out for the number of companies that missed expectations. “At 67.3%, the earnings beat rate for [fourth-quarter 2022] is the lowest the rate has been since [first-quarter 2020] (the start of the COVID-19 pandemic)” wrote Robert Carey, the chief market strategist at First Trust Advisors.
Refinitiv calculates that the long-term average for companies beating earnings expectations is 62.0% and the average percentage of beats over the past four quarters is 72.8%. In addition, Refinitiv notes that the S&P 500 companies are “reporting earnings that are 1.0% above estimates, which compares to a long-term (since 1994) average surprise factor of 4.1% and the average surprise factor over the prior four quarters of 5.3%.”
Source: First Trust Advisors.
More Than Half of Stocks Are Buys?
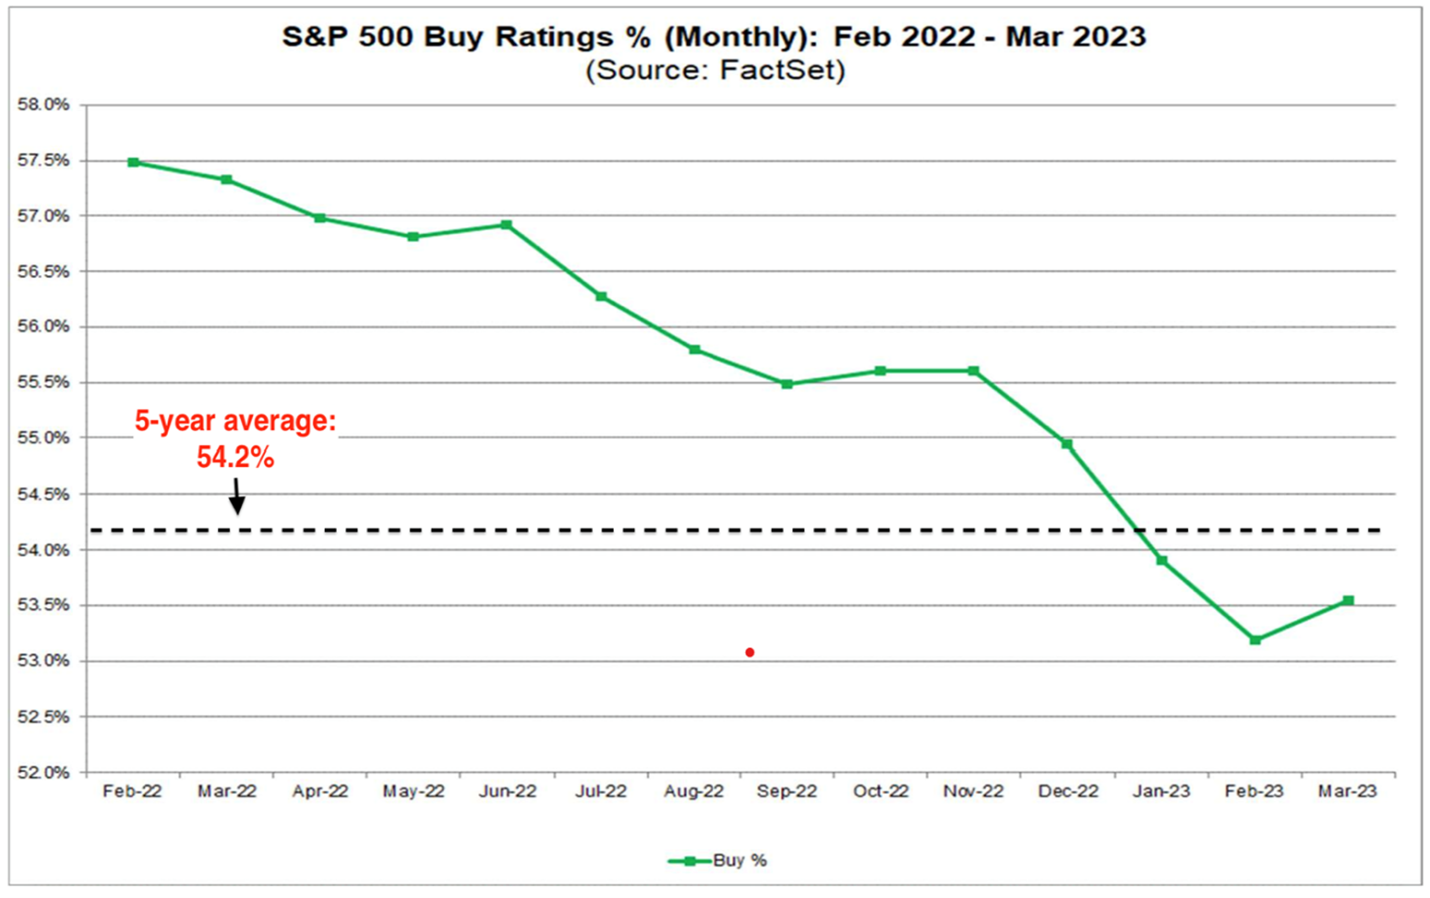
DataTrek Research noted in one of its recent daily emails that 53% of analysts’ recommendations are “buys” based on data from FactSet. Though down from 57.5% one year ago and still below the historical average, the number shows that analysts continue to view the stocks they cover as being akin to the kids from Lake Wobegon, meaning above average.
This is a continuation of a longstanding bias toward issuing buy recommendations and refraining from issuing sell recommendations.
Source: DataTrek.
Money Market Funds Are in Vogue
Earlier this month, Refinitiv Lipper observed that “money market funds have realized two of their top 20 weekly inflows of all time this year.” In addition, money market funds started 2022 by receiving the largest amount of combined January and February inflows since 2008.
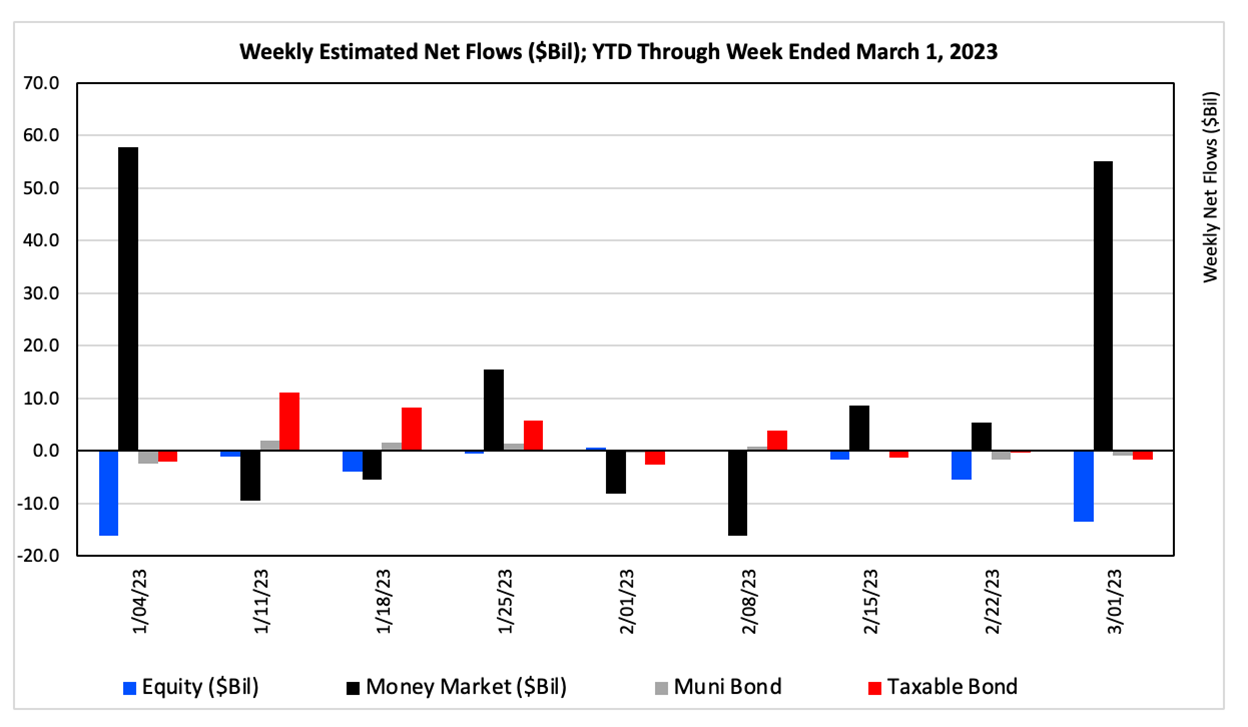
Source: Refinitiv Lipper.
Somewhere Jed Clampett Is Smiling
Jed Clampett may have stumbled upon some instant wealth when he found “Texas Tea” in the opening to “The Beverly Hillbillies,” but the current profit margins of energy companies might even make him blush. “Profit margins for energy companies currently stand at a historical high, having notched their fastest rebound from trough levels in 30 years,” observed BlackRock.
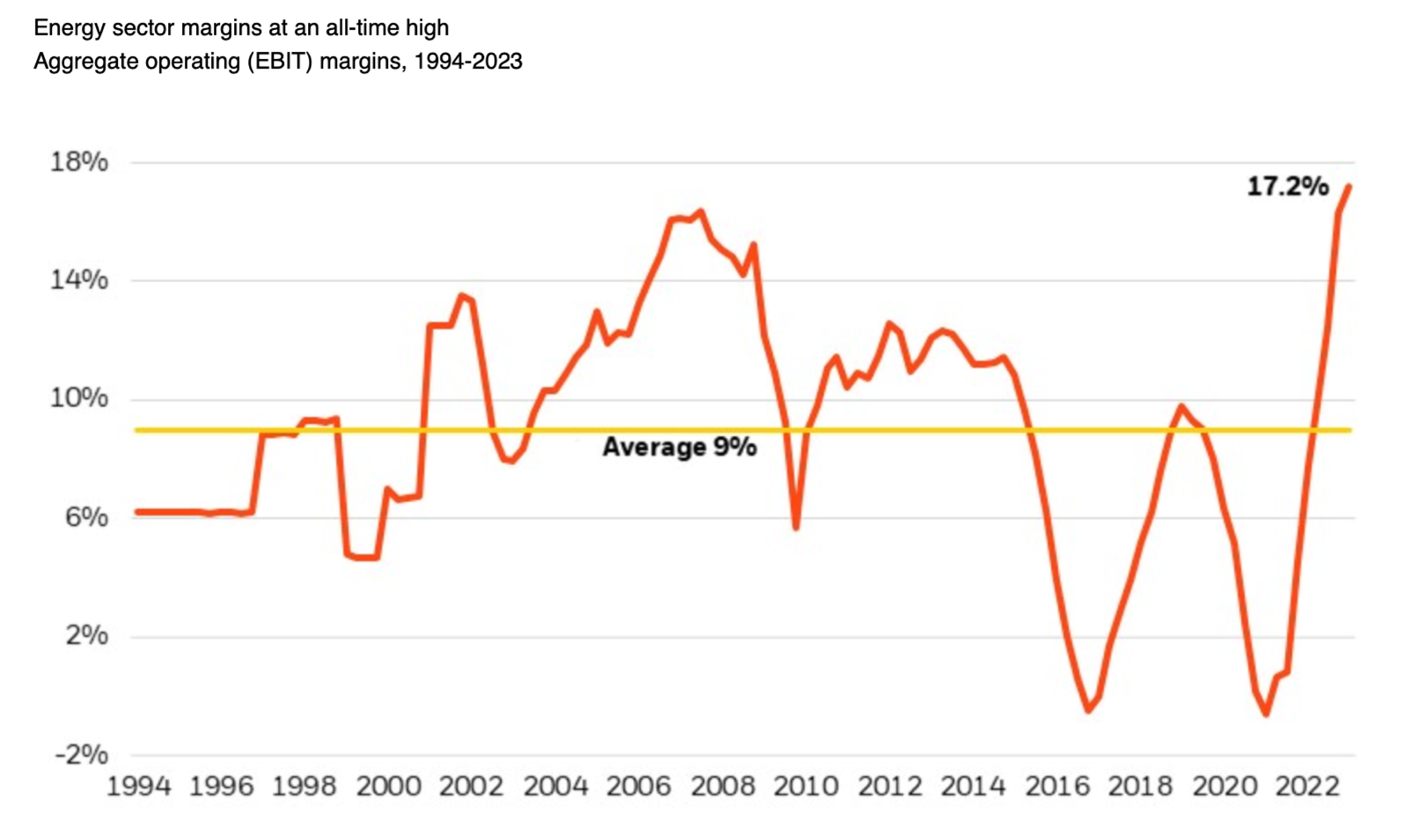
Source: BlackRock Fundamental Equities. Data from Refinitiv as of 2/14/2023. Aggregate earnings before interest and taxes (EBIT) margins are shown for the trailing 12-month period for the energy sector within the S&P 500.
Yes, It Is a Good Idea to Avoid Zombies
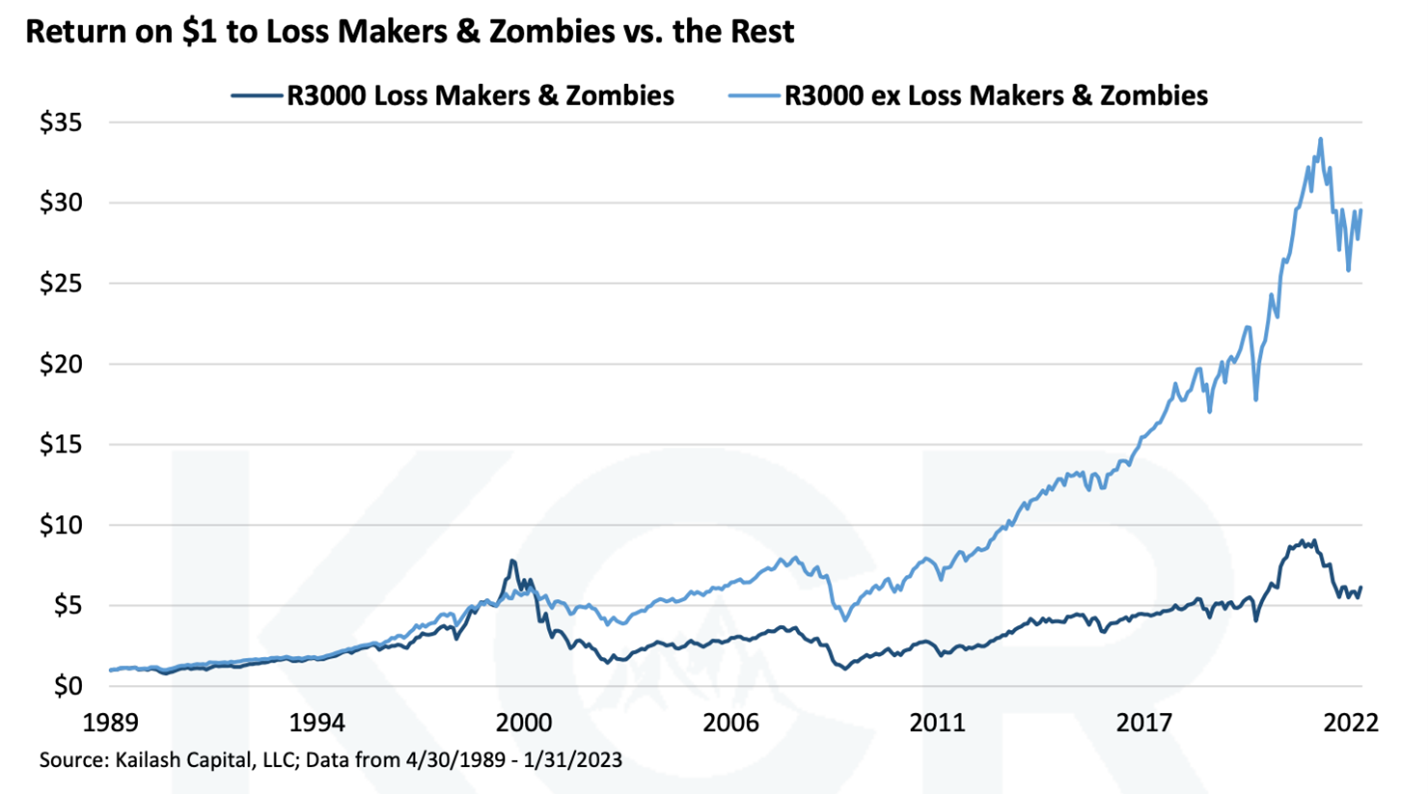
One simple but important part of successful stock selection is to avoid the junkiest companies. Kailash Concepts Research looked at what would have happened if you just avoided so-called “loss makers and zombies.” These are Russell 3000 index companies that “either lose money or have interest expenses greater than operating income.” Unsurprisingly, returns increase when you avoid these stocks.
Going to Need More Candles
Finally, here is a chart about life expectancy from J.P. Morgan Asset Management’s 2023 Guide to Retirement. There is at least a 50% chance of one person in an age-65 married couple living to at least age 90. It’s a 73% chance if they are in good health and not smokers. That’s quite a large number of candles to put on the birthday cake …
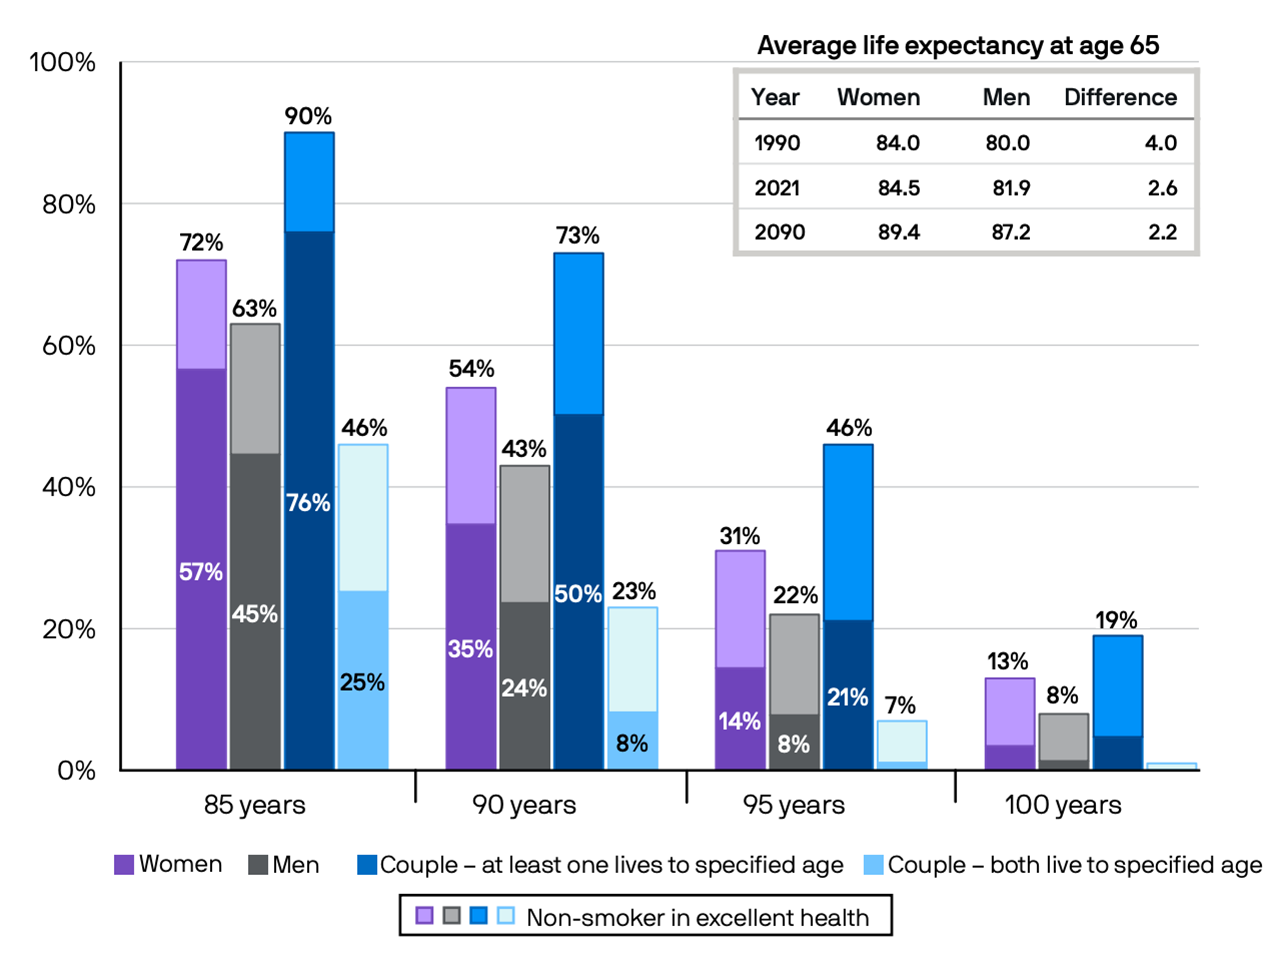
Source: J.P. Morgan Asset Management.

-
Follow the Fed, but Be Smart About It
Small-cap stocks thrive during periods of expansive monetary policy, while returns for large- and small-cap stocks are lower during restrictive periods. -
How to Analyze Earnings Surprises
An earnings surprise occurs when a company’s reported profits are above or below financial analysts’ expectations, which can change its share price. -
A Look at Five Leading Alternative Investment Platforms
A new set of investing platforms has emerged to expand individual investors’ access to asset types such as cryptocurrency, private debt, private real estate and fine art. -
Diversify Tax-Exempt Interest Income With Muni National Bond Funds
If you are in a higher tax bracket and your portfolio generates significant income from fixed-income investments such as bonds that are not held in tax-deferred accounts, then you might consider using tax-exempt income sources such as municipal bond funds. -
Early Retirement Linked to Cognitive Decline
Early retirement can accelerate cognitive decline due to a reduction in social interaction and activities requiring individuals to be mentally sharp.
Members are looking for your input. Can you help with this question from the Retirement Withdrawals Community?
“Does anybody on this forum have experience with fixed index annuities? Positive or negative?”
Tap the button and then choose the Join the Community button on the right to answer this question in the AAII Community
Answer This Question in the AAII Community »
AAII Sentiment Survey
Pessimism among individual investors continued to move closer to 50% in the latest AAII Sentiment Survey. Neutral sentiment ended its streak of above-average readings, while optimism rebounded.
Bullish sentiment, expectations that stock prices will rise over the next six months, rose 1.7 percentage points to 20.9%. Optimism is at an unusually low level for the fifth consecutive week and the 45th time out of the past 64 weeks. Bullish sentiment is also below its historical average of 37.5% for the 68th time out of the past 70 weeks.
Neutral sentiment, expectations that stock prices will stay essentially unchanged over the next six months, fell 2.2 percentage points to 30.2%. The drop puts neutral sentiment below its historical average of 31.5% for the first time since December 29, 2022 (25.9%).
Bearish sentiment, expectations that stock prices will fall over the next six months, rose 0.5 percentage points to 48.9%. Pessimism was last higher on December 22, 2022 (52.3%). This is the fourth consecutive week and the 43rd time out of the past 64 weeks that bearish sentiment is at an unusually high level. Bearish sentiment is also above its historical average of 31.0% for the 65th time out of the past 70 weeks.
The bull-bear spread (bullish minus bearish sentiment) rose by 1.2 percentage points to –27.9% but remains unusually low for the fifth consecutive week. The bull-bear spread is at an unusually low level for the 47th time out of the past 64 weeks.
This week’s bullish sentiment reading ranks among the 70 lowest readings since the AAII Sentiment Survey started in July 1987. This week’s bearish sentiment reading ranks among the 90 highest readings in the survey’s history. Twenty of those 90 bearish sentiment readings have registered since the start of 2022.
Historically, the S&P 500 index has gone on to realize above-average and above-median returns during the six- and 12-month periods following unusually low readings for bullish sentiment and the bull-bear spread. Similarly, the market benchmark has gone on to realize above-average and above-median returns during the six- and 12-month periods following unusually high readings for bearish sentiment.
Beyond the recent bank headlines and downside market, monetary policy, interest rates, inflation and the pace of economic growth are all influencing individual investors’ short-term outlook for stocks.
This week’s special question asked AAII members how they would describe the current valuation of stocks. Here are the responses:
- Stocks, in general, are fairly valued: 13.6%
- Stocks, in general, are undervalued: 14.6%
- Stocks, in general, are overvalued: 25.4%
- Valuations are mixed, with some stocks expensive and others cheap: 40.5%
- Not sure/no opinion: 5.6%
Bullish: 20.9%, up 1.7 points
Neutral: 30.2%, down 2.2 points
Bearish: 48.9%, up 0.5 points
Bullish: 37.5%
Neutral: 31.5%
Bearish: 31.0%
See more Sentiment Survey results.

March 16, 2023 Banks Behaving Badly, and How Your Accounts Are Insured
March 9, 2023 Both Small-Cap and Large-Cap Stocks Rebound Strongly
March 2, 2023 Buffett on Buybacks, Dividends and Investing Mistakes
February 23, 2023 Portfolios With the Lowest-Cost Mutual Funds and ETFs

Discussion
Barry from TX posted over 3 years ago:
Charles, thanks for the bounty of charts and sparse prose. I prefer this ratio to extra text. I prefer to see the data and draw my own conclusions than to be spoon-fed pablum (such as the current focus in politics and media on “narratives”). I looked for a theme across the 8 charts. I settled on a circus theme – a parade of opportunities to be scammed and to see abnormalities. In the Midway, you have to walk a gamut of distractions and scams to get to the “Big Show” in the Main Tent – the acrobatics billed as “The AAII Sentiment Survey” trapeze act. Here’s what I saw there. Sentiment gross category percentages move like glaciers. It’s the changes BETWEEN categories that draw the oooohs and aaaahs that delight the crowd. In this survey, 2.2% of Neutrals moved -- 1.7% up to Bulls and 0.5% down to Bears – very similar to a double jump trapeze act. Converted to percent changes, 77% of the movement in total sentiment was to Bulls and 23% to Bears. That’s a 3-to-1 Bullish ratio. Glaciers move slowly. A change of just a few feet tells how how much the “climate” is changing. In US politics, every election since 2000 has been decided by smaller percent changes than these changes. Compare the impact those changes at the margins made to market performance or non-performance. JFK’s “Profiles in Courage” teaches the same lesson. As few as one person can make all the difference in the course of history during times of great change. Add to this the latent lesson in the trapeze act. You have to let go of the bar you are holding on to now so you can grab the new bar coming to rescue you. I applaud the 2.2% of AAIIers who performed this month’s trapeze act.
Sneha J from Mumbai, India posted over 3 years ago:
Hi MY GREETINGS We now need a customized Screener which specifically covers GARP (Growth at Reasonable Price) Stocks on daily basis. Also please revel the various exact parameter matrix (norms) which will be considered while hunting such stocks from all the listed Stocks on AMEX, NASDAQ & NYSE. Thanks & Regards! E-Mail > ppjoshi49@gmail.com
You need to log in as a registered AAII user before commenting.
Create an account