

May Charts of Interest: Is the Fed Done Raising Rates?
by Charles Rotblut | May 18, 2023
As I write this month’s Charts of Interest, traders are placing a 72% probability on the Federal Open Market Committee (FOMC) holding interest rates steady at its meeting on June 13 and 14. This would mark the first time they haven’t raised interest rates since January 2022.
What has historically happened after the Federal Reserve pauses interest rate hikes? “Since 1989, the S&P 500 gained an average of 13% between the last rate hike and the first rate cut, gaining in price in five of six periods,” observed CFRA Research’s chief investment strategist Sam Stovall. “What’s more, the market continued its advance six months after the first rate cut, rising an average of 6.5% and gaining in price four out of six times.”

When Will the Fed Start to Cut Rates?
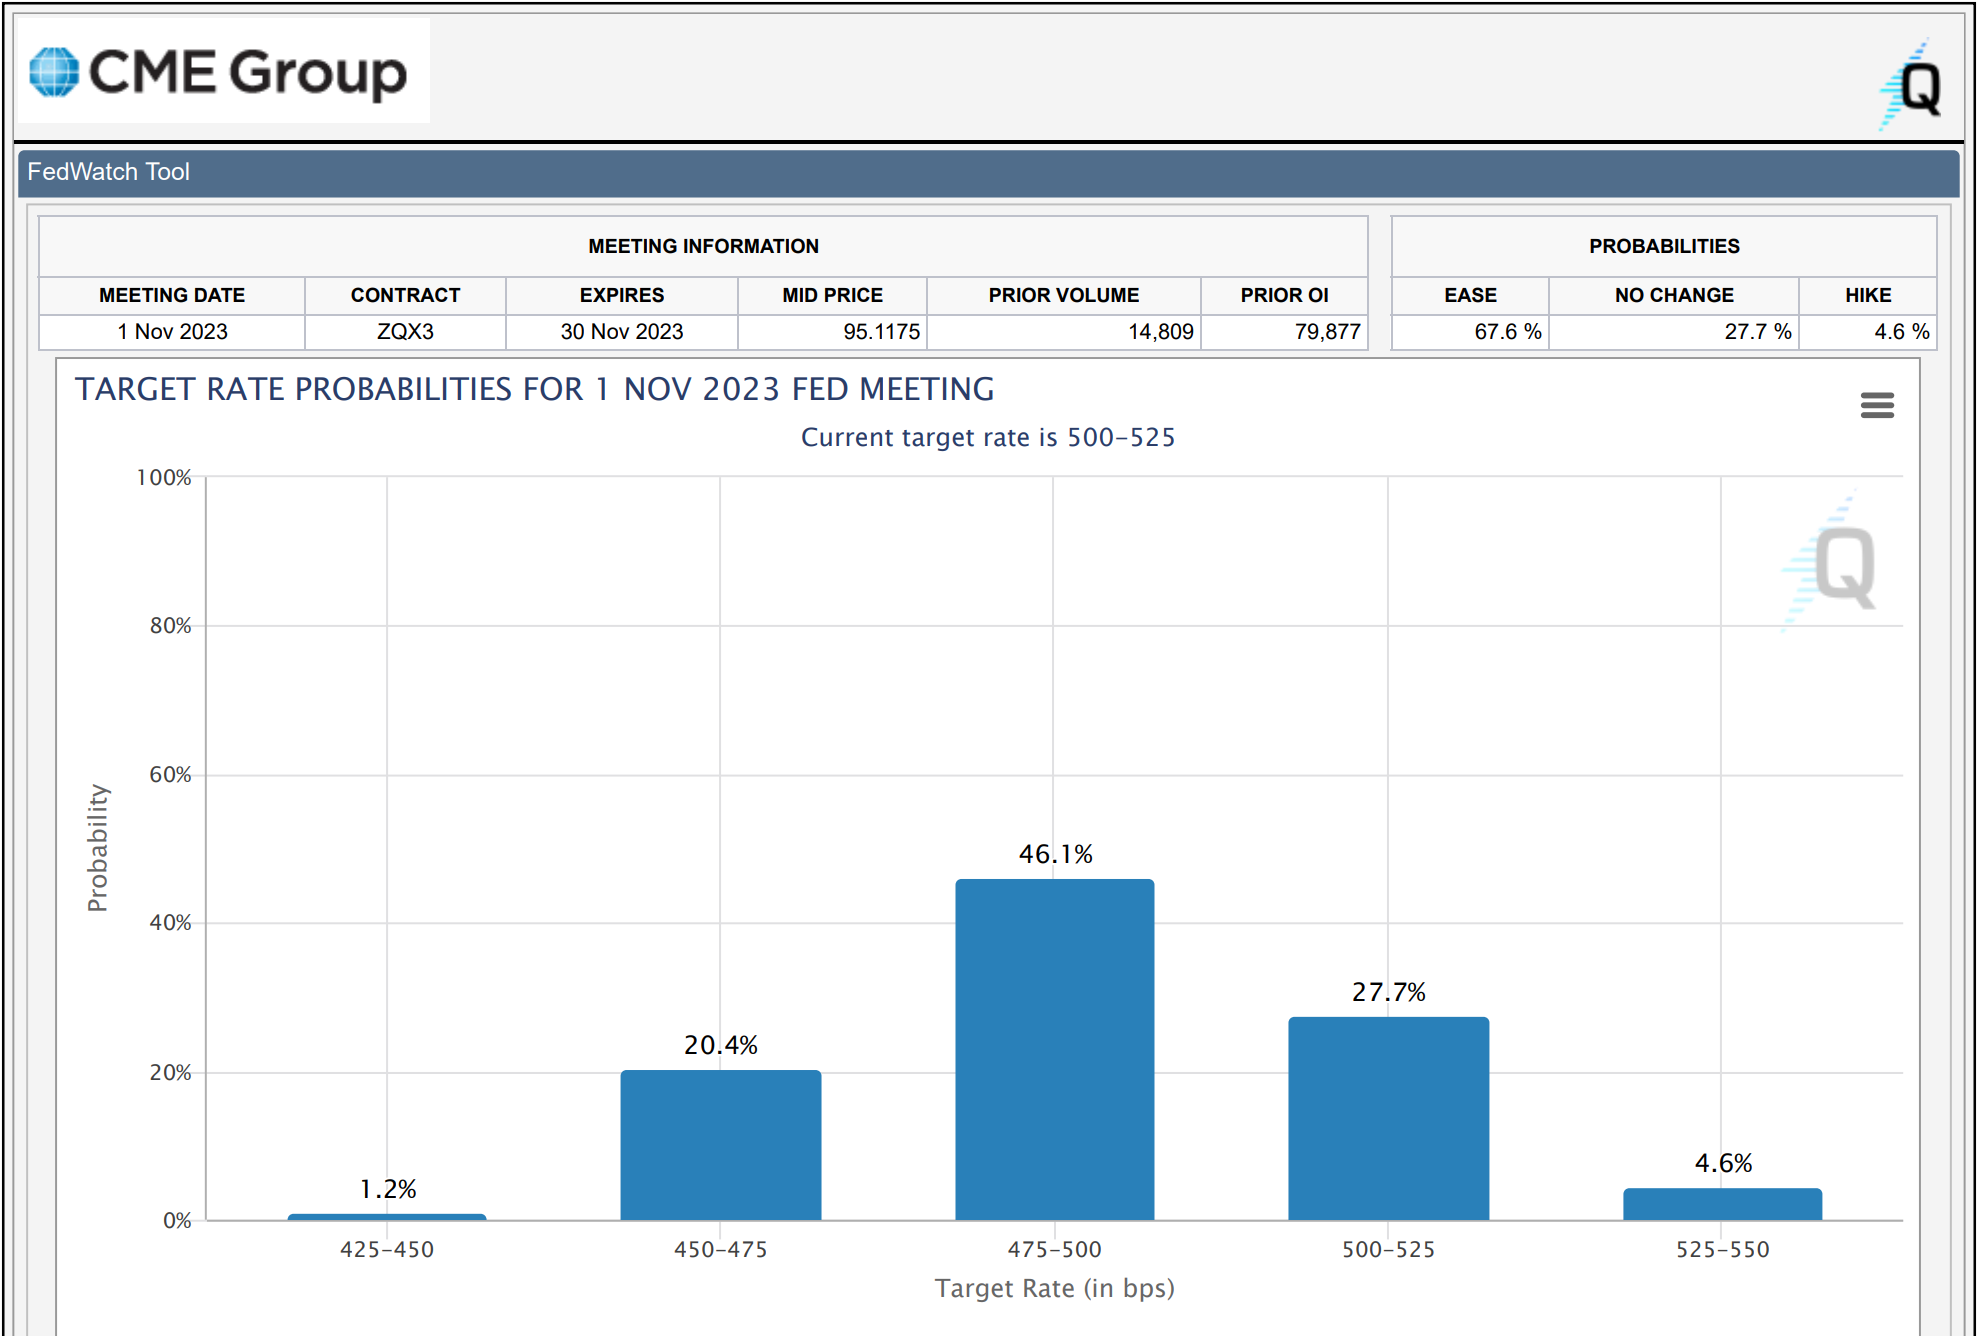
This is the $64,000 question. No one really knows, as it’s going to depend on the data and future developments. The first meeting where the federal fund futures market is pricing in majority odds on an interest rate cut being announced is the two-day meeting on October 31 and November 1. I strongly encourage you to pay attention to the spread of probabilities below—there is a noticeable amount of uncertainty about what will happen. More importantly, these odds will change in the months ahead.
A Reason to Hold Instead of Sell in May
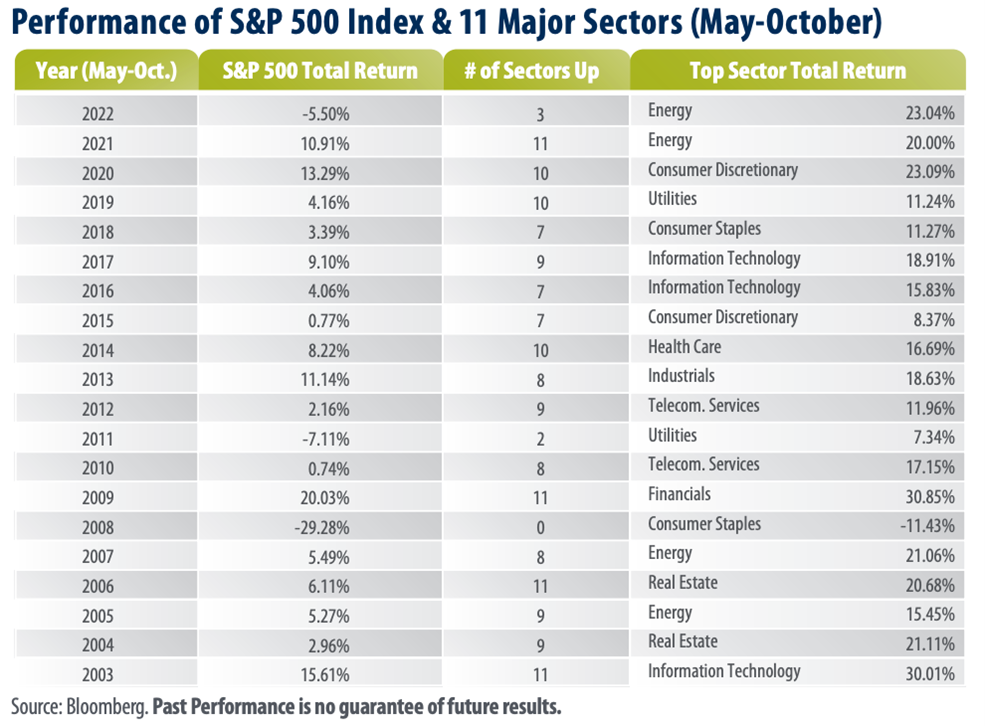
Since 1945, the S&P 500 index has underperformed between May and October relative to the other (“best”) six months. But it hasn’t made sense to pull out of stocks during these months. Here’s what Robert Carey, the chief market strategist at First Trust, noted:
- “From 2003 through 2022, there were just three instances (2008, 2011 & 2022) in which the S&P 500 Index posted a negative total return from May through October, and the 2008 occurrence was during the financial crisis.
- “The average total return for the S&P 500 Index for the May–October periods in the table was 4.08%, which is nothing to run from, in our opinion.
- “Seventeen of the twenty top-performing sectors in the table posted total returns in excess of 10.00% (May–October). For comparative purposes, from 1926–2022 (97 years), the S&P 500 Index posted an average annual total return of 10.12%, according to Ibbotson & Associates/Morningstar.”
A Bank Run on Financial Services ETFs
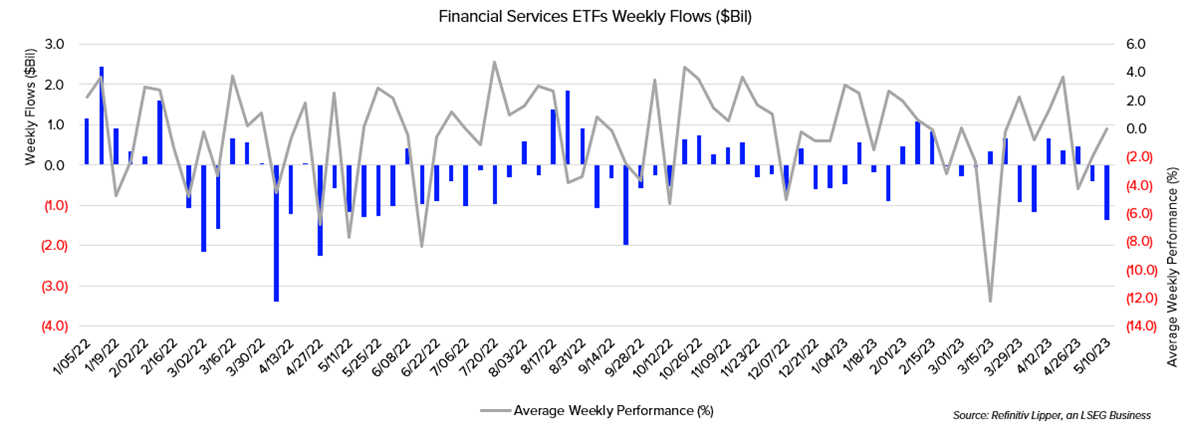
Investors are voting with their feet when it comes to bank ETFs. Quoting directly from an email I received this week:
“Lipper Financial Services ETFs recorded their largest weekly outflow of the year over the past fund flows week (–$1.4 billion). It was their highest outflow total since September 2022 and the twenty-sixth largest on record. Financial Services ETFs posted their worst annual net flow during 2022 (–$14.5 [billion]) and were slowly clawing back at that total until the last two weeks of outflows.”
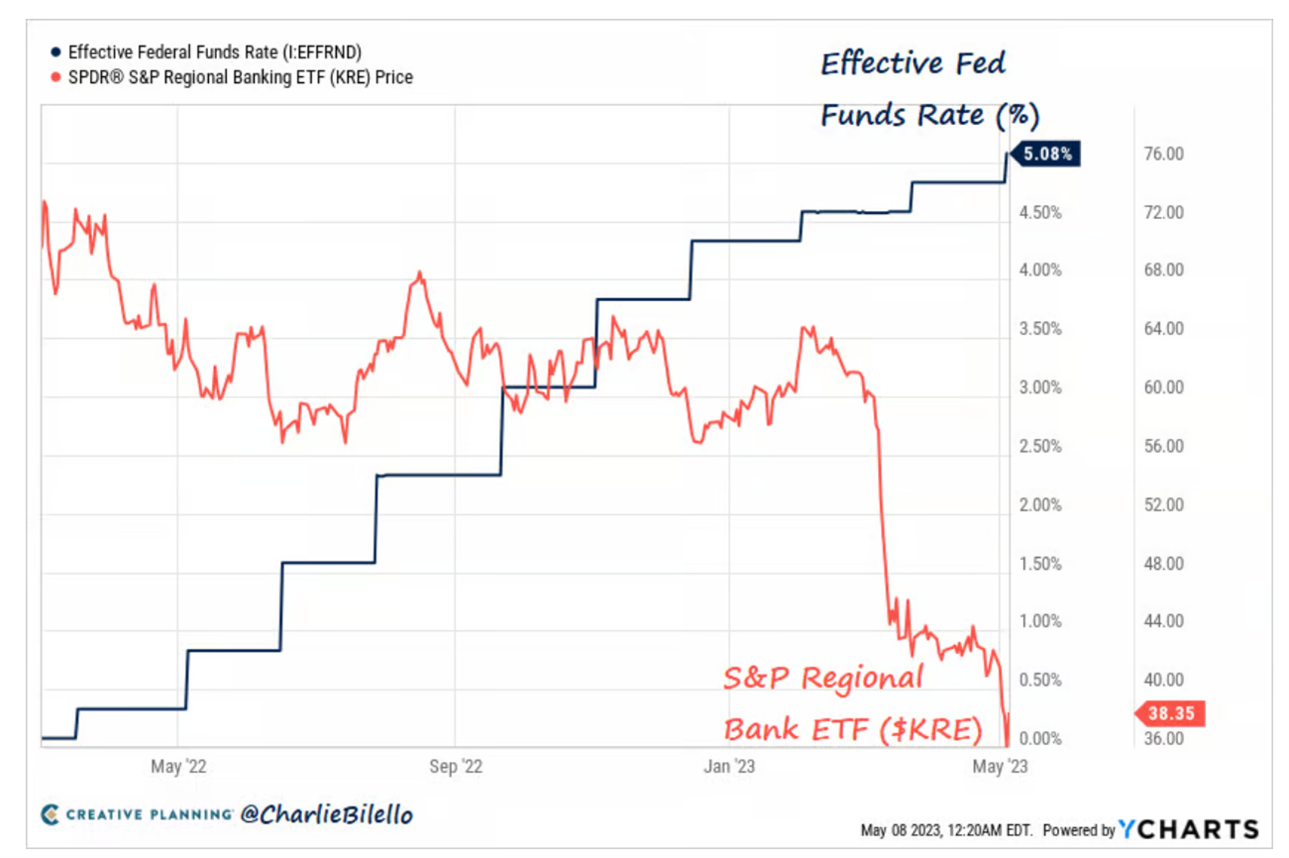
And here’s a chart that Pension Partners LLC director of research Charlie Bilello included in his weekly email:
All That Shines …
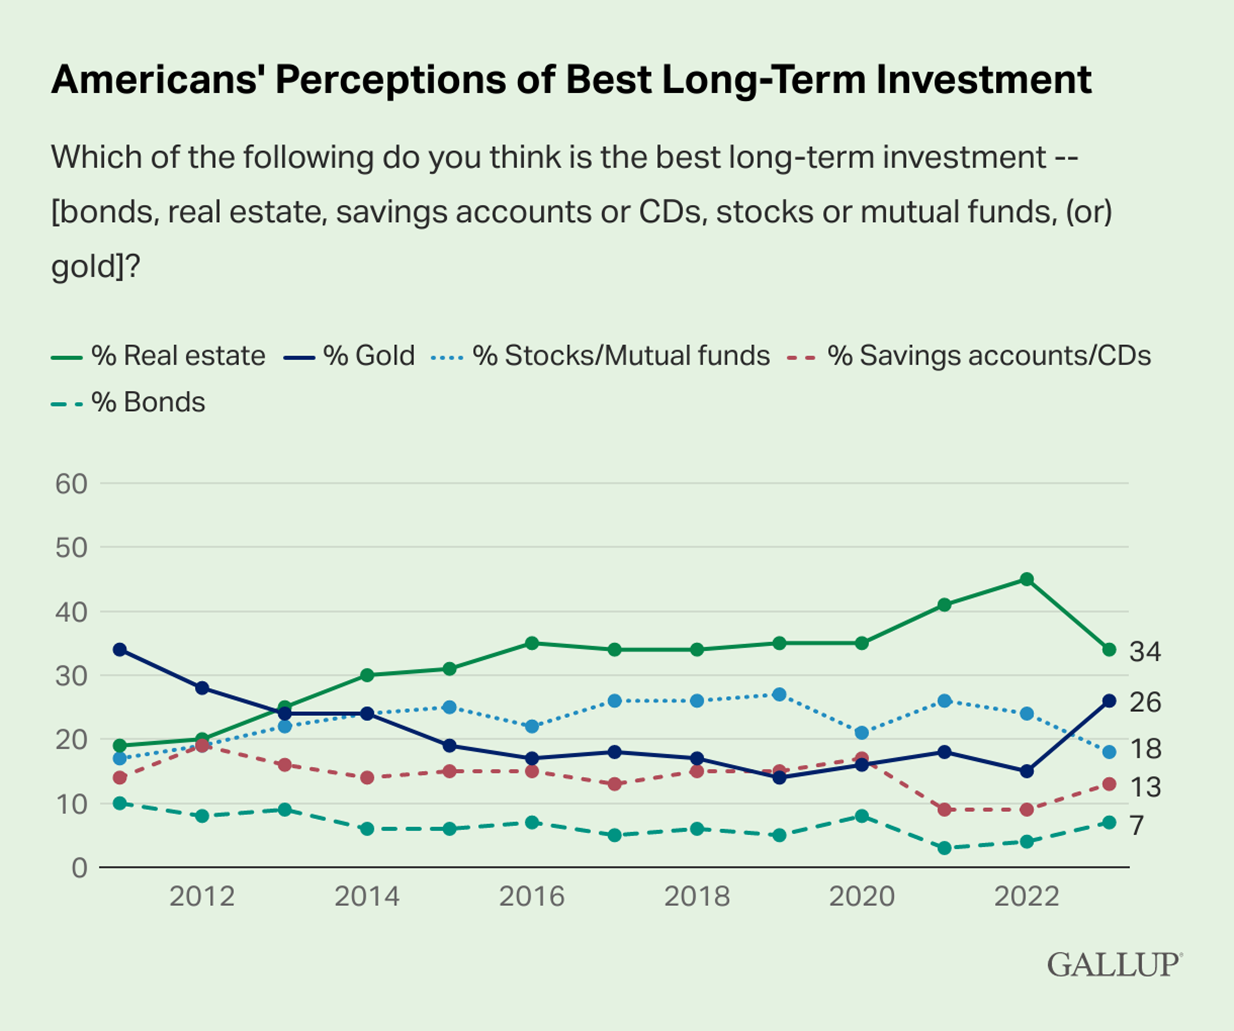
I’ll end with a recurring survey that Gallup conducts about what Americans view as the best long-term investment. Real estate remains on top in the most recent results, but gold has made quite the comeback.
Notably, the lack of optimism about stocks we’ve noticed in other surveys can also be evidenced here. As Gallup wrote, “Today’s preference for stocks is on the low end of the 17% to 27% range of Americans choosing it since 2011.”

-
It's Been Difficult for the Fed to Pull Off Economic Soft Landings
Most prior rate-hike cycles have been followed by recessions, so-called hard landings. Only one of the 11 previous rate-tightening cycles has resulted in a perfect soft landing. -
“Sell in May” Has Weakened as a Strategy
The strategy of holding stocks between November and April and avoiding them between May and October was first discussed in an academic journal in 2002. Questions have arisen as to whether the attention given to the strategy has hurt its returns. -
A One-Page Wealth-Building Plan to Get a 60-Year-Old Couple to Retirement
The years leading up to retirement involve many important decisions. A simplified plan is essential to keep you on track. -
The Rules Regarding Retirement Account Rollovers
Terms and tips to help you decide whether to transfer retirement savings from one account to another. -
Auto Rollovers May Lead to Account Abandonment
Employees whose retirement plan assets are automatically rolled over into an IRA when they leave their jobs are at greater risk of losing track of their accounts.
Members are looking for your input. Can you help with this question from the Allocation Strategies Community?
“The AAII Journal article ‘What Helps and Doesn’t Help Find Top-Performing Stocks’ sheds light on the benefits and limitations of using earnings surprises and price targets to identify top-performing stocks. Do you use earnings surprises and price targets in your stock selection process? If so, how?”
Tap the button and then choose the Join the Community button on the right to answer this question in the AAII Community
Answer This Question in the AAII Community »
AAII Sentiment Survey
Optimism decreased and is at a seven-week low in the latest AAII Sentiment Survey. Neutral sentiment increased, while bearish sentiment decreased.
Bullish sentiment, expectations that stock prices will rise over the next six months, decreased 6.5 percentage points to 22.9%. Optimism reverted to an unusually low level and is at a seven-week low. Bullish sentiment is unusually low for the 51st time out of the past 72 weeks.
Neutral sentiment, expectations that stock prices will stay essentially unchanged over the next six months, increased 8.0 percentage points to 37.4%. This puts neutral sentiment above its historical average of 31.5% for the first time in three weeks.
Bearish sentiment, expectations that stock prices will fall over the next six months, fell 1.5 percentage points to 39.7%. Pessimism is back within its historical range after two consecutive weeks at unusually high levels. Bearish sentiment remains above its historical average of 31.0% for the 73rd time out of the past 78 weeks.
The bull-bear spread (bullish minus bearish sentiment) dropped to –16.8% and remains unusually low for the fourth consecutive week.
This week’s special question asked AAII members what impact the current standoff over raising the debt ceiling has on their sentiment toward stocks. Here are the responses:
- A significantly negative impact: 18.8%
- Some impact, but not significantly negative: 24.4%
- Believe it could lead to buying opportunities: 23.9%
- No impact on my sentiment: 27.8%
- Not sure/no opinion: 5.1%
Bullish: 22.9%, down 6.5 points
Neutral: 37.4%, up 8.0 points
Bearish: 39.7%, down 1.5 points
Bullish: 37.5%
Neutral: 31.5%
Bearish: 31.0%
See more Sentiment Survey results.

May 11, 2023 Continue to Hold I Bonds or Sell Them?
May 4, 2023 Setting Aside Self-Doubt When It Comes to Allocation
April 27, 2023 A Growth Stock or Not? Plus, Other Notes From the Morningstar Investment Conference
April 20, 2023 April Charts of Interest: Don't Jinx It

Discussion
Barry from TX posted over 3 years ago:
Charles, your recent monthly series of charts and data to help members think through the significance of the undisciplined parade of current events various sources throw at us is the best article each month among all of the others. AAII staff articles are very good, too. This series shames most guest authors who mainly try to indoctrinate us “ignorant, unwashed masses“ on the value their most recent book brings into our chaotic investing lives. Good luck with that, gentlemen. I, for one, am hardcore cynical when I read anything that the source is some East Coast cognoscenti. I learn significantly more by reading AAII member comments. The example at hand is “A Reason to Hold Instead of Sell in May?” Robert Carey’s own data makes the case FOR considering a “Sell in May and Go Away” strategy in 2023. (#1) His long-term 1945-2022 data compares the May-Oct strategy to “the (“best”) 6 months.” This is not an apples-to-apples comparison. Those (“best”) 6 months include some of the months in May-Oct. A “SIM-AGA” strategy does not advocate cherry-picking each month as you go. That is another false comparison. He cherry-picked his data again. (#2) “2003-2022 there were just 3 instances (2008, 2011 & 2022) when SPX posted a negative total return May-Oct.” This short-term [the last 20 years] conjecture is also based on a cherry-picked subperiod. All this statistic proves is that there was a 15% expectation that the probability of a negative return in May-Oct 2023 is 15%. It was chosen to infer that the “danger” in this strategy is increasing contemporaneously. Once again, his own data proves this is not accurate. The expectation of receiving a positive return 85% of the time are odds FAR SUPERIOR than you get in ANY casino and in ANY equity investment in ANY market (except for the history fixed income). The legendary “equity premium “ of equity markets quoted by many sources over many periods is usually around 4% net of costs. (#3) Zooming into the very short term (the year 2023 YTD) using YTD data, the odds of a “positive return” narrow. The overall article is peppered with allusions to the uncertainty of future Fed FFR decisions. Traders are placing a 72% probability on FOMC holding interest rates steady in June. That implies the odds are 28% the Fed could RAISE rates. Those are about 1 in 4 odds. In craps, 1:4 odds are the high end of the odds offered. (#4) “SPX average total return May–Oct was 4.08%. Charles opines that a 4% ROI is “not to run from.” That is significantly better advice than Mr. Carey offers. (#5) The table with the performance data for the 11 SPX sectors in May-Oct over 2002-2022, the last 20 years, only proves that sectors rotate market leadership over time. The 2022 race is not over, NRG could very well lose its leadership to IT or any defensive sector if the economy shifts for any number of reasons, including any of several bricks being added to the “wall of worry” as I write. PS -Liz Sonders of Schwab publishes a “quilt” graphic displaying sector rotation performance both yearly and monthly. It provides much more data in a better format than any table. She uses it like you do, as a piece in the mosaic to evaluate the overall “motion picture” the market presents. This ends my review of the data and arguments AGAINST a “SIM-AGA” strategy.
Barry from TX posted over 3 years ago:
Here's my take on the nudges in this article (Shout out to Dick Thaler for explaining how nudges work. The goal is to shift the perception of the probabilities among the choices presented.) Zooming in from the cherry-picking of historical data periods to the ultra-short-term realities of today, what are the odds for the success of a “Sell In May and Go Away” strategy TODAY (when you are actually making the decision)? (#1) See all my concerns about the cherry-picked data listed above. (#2) The current AAII Sentiment survey shows an overall 8% shift from Bullish to Neutral (6.5%) and to (1.5%) Bearish that elevates Bears to 4O% versus Bulls at 23%, or approximately 2:1. The fact that 37% are indecisive only magnifies the importance of the shift in sentiments. When you are "neutral," how do you act? Being “neutral” approximates a “Check and Pass” strategy in poker. You only know the probabilities of your own hand; you want to stay in the game; but you want to see “how the cards flop” to see if they improve your odds. Neutral is the passive-aggressive version of a Bearish strategy. This logic infers that AAII members are 77% NOT Bullish. We are anxious, not happy, campers this summer. We are looking to improve our current odds. (#3) Most studies have found that the long-term GROSS ROI for SPX is around 7% +/-1% and 5% net. (#4) Several sources offer money market funds in the 4.0%-4.5% range. (#5) If you are facing high levels of uncertainty (77% per the AAII data) which could change any odds you currently hold, you might want to look for safer alternatives. (#6) When the Fed raised rates in 2023, it shifted the overall rate floor to 5.0%-5.25%. (#7) As a result, in 2023, Money Market Funds provide higher rates up to 4.75%. (#8) The certainty in ROI INCREASES the “margin of safety” significantly closer to “certainty” and DECREASES the probability of a “real loss” (some call these “catastrophic” losses because they take 10-20 years to recover losses) and satisfice for a “safer” 4.0% or so NET ROI while you implement a “Check and Pass” strategy. (#9) MMFs can be converted to CASH in 24 hours. This gives the option to re-enter the market as it improves while you wait out the many decisions that will move equity market (“whipsaw”) odds up or down. (#10) In the periods Mr. Carey cites, the opportunity to earn 4% through near-cash alternatives was not available. The average spread between fixed-income (2%) and equity (6%) or 4% was not as attractive as today where the average spread is over 2%. (#11) I always sleep better when I can reduce the probability of unlimited NEGATIVE DOWNSIDES and still earn enough to pay the bills while I wait for the resolution of a set of events that make sitting in for another hand much more attractive. Comments?
You need to log in as a registered AAII user before commenting.
Create an account