

How the VMQ Stocks Momentum Indicator Was Changed
by Charles Rotblut | July 18, 2019
Last week, the momentum indicator used in the VMQ Stocks strategy was changed. I want to share with you what was done and a few things to consider when using momentum in a broader strategy. (See the end of this week’s commentary for a special $1 trial offer on VMQ Stocks.)
Before I do, a bit of background may be helpful. Momentum is the strategy of buying stocks whose share prices have outperformed. Both academic and industry research have shown that portfolios of “winner” stocks continue to outperform while portfolios of “loser” stocks continue to underperform. Momentum is technically defined as a stock’s relative price strength rank. Relative strength is a stock’s price return over a certain period of time relative to the returns of all other stocks. The greater the degree to which a stock has performed, the higher its relative strength rank will be.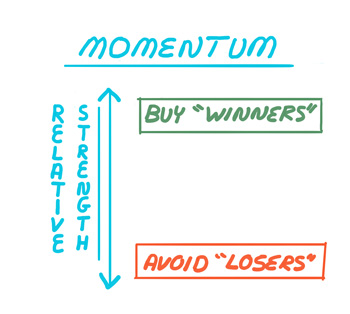
The original research into momentum looked at relative strength over the past 52 weeks. Subsequent research found that higher levels of relative strength over the past 13 to 52 weeks leads to continued outperformance for periods of a year or more. Thus, an investor seeking to use momentum has some flexibility in how long their “lookback period” is. It is also possible to use a four-week period, though analyses of a period this short have not shown it to lead to ongoing outperformance. In AAII’s Stock Investor Pro stock screening and database program, the relative strength rank is calculated for stocks over four-, 13-, 26- and 52-week periods.
A weighted momentum indicator is also calculated in Stock Investor Pro. The weighted four-quarter relative strength rank considers a stock’s relative price performance over each of the past four quarters. Specifically, it assigns a 40% weight to a stock’s most recent quarterly price change and a 20% weight to the price change of each of the prior three quarters. This weighting process gives more emphasis to how the stock has performed recently, while still giving significant consideration to how a stock has performed in the quarters leading up to the most recent period. It is a bridge of sorts between the 13-, 26- and 52-week relative strength ranks.
When choosing which momentum indicator to use, returns are a consideration particularly from the standpoint of how the indicator interacts with other parts of the strategy. In VMQ Stocks, momentum is combined with value and quality indicators. Thus, how the entire strategy worked together was evaluated instead of just its individual parts. The same logic would have applied if a different combination was used, say growth and momentum, or a completely different path like dividend growth and low volatility. In investing, it’s always helpful to consider the sum of a strategy’s parts and not just the individual parts alone.
Prior research has shown that value and momentum pair well together, so before the VMQ strategy was even created, we knew that we wanted a portfolio combining the two factors. When we launched VMQ Stocks last year, value criteria were paired with the 26-week relative strength rank. In reviewing the choice of momentum criteria this year, relative strength indicators ranging from 13 weeks to 52 weeks were looked at. We found that while the original choice (the 26-week relative strength rank) worked well, switching to the weighted four-quarter relative strength rank worked even better. The annualized returns on the hypothetical portfolios tested were 7.0% and 8.7%, respectively, for the period of 1999–2018. In contrast, the Vanguard 500 Index fund (VFINX) returned 5.5% on an annualized basis over the same period.
None of this is to say that the hypothetical portfolios outperformed each and every year. Any time you stray from having a market-like portfolio (e.g., by owning a market-cap-weighted index fund), you’re going to end up with returns that are different than the market. Over shorter time periods (e.g., one year), those returns will be better or worse. (Of course, tracking the market will also give you good and bad years.) If you’re comfortable with straying from the market, willing to endure bouts of shorter-term underperformance in exchange for longer-term outperformance and find momentum to be an appealing characteristic approach, a blended indicator like the weighted four-quarter relative strength rank may be worth considering. If you like the idea of combining value, momentum and quality into a single strategy, we’re currently offering a 60-day $1 trial to VMQ Stocks.

-
Momentum’s Role as a Driver of Stock Prices – Those of you who want to learn more about momentum and the research behind it may find this article to be of interest.
-
Investing’s Odd Couple: Value and Momentum – In this 2013 article, Kevin Truitt of our AAII Chicago Chapter explained why value and momentum pair well together.
Optimism among individual investors about the short-term direction of the stock market increased for the fourth consecutive week. The latest AAII Sentiment Survey also shows a small increase in pessimism and a decline in neutral sentiment.
Bullish sentiment, expectations that stock prices will rise over the next six months, rose 2.3 percentage points to 35.9%. This is a 10-week high. Nonetheless, bullish sentiment remains below its historical average of 38.5% for the 10th consecutive week and the 22nd time this year.
Neutral sentiment, expectations that stock prices will stay essentially unchanged over the next six months, pulled back by 3.5 percentage points to 35.4%. Even with the decline, neutral sentiment is above its historical average of 31.0% for the 24th time in 25 weeks.
Bearish sentiment, expectations that stock prices will fall over the next six months, rebounded by 1.1 percentage points to 28.6%. Pessimism was last lower on May 8, 2019 (23.2%). The historical average is 30.5%.
All three indicators are currently within their typical ranges.
This week’s special question asked AAII members what factors are most influencing their six-month outlook for stocks. Slightly more than a third of all respondents (34%) say Washington politics, including President Donald Trump. The ongoing trade war is a close second, listed by 33% of all respondents. Nearly 26% say slowing economic growth while 13% mention the economy’s sustained expansion. Monetary policy, interest rates and the Federal Reserve are influencing the outlook of 24% of respondents. Many respondents list more than one influence.
Here is a sampling of the responses:
- “Fed response to the economic situation, particularly trade tensions and slowing GDP.”
- “Slowing corporate economic activity, probably the confusion over the trade and other economic policies of this administration.”
- “The economy appears to be strong and the inverted yield curve indicates that the downturn may be farther out.”
- “With earnings still looking good as well as the job market, I feel the stock market will continue to rise into early 2020.”
- “Federal Reserve, slowing global economy and trade standoff with China; I don’t know how any of them will pan out and how the market will respond.”

Bullish: 35.9%, up 2.3 points
Neutral: 35.4%, down 3.5 points
Bearish: 28.6%, up 1.1 points
Bullish: 38.5%
Neutral: 31.0%
Bearish: 30.5%
July 11, 2019 The Financial Markets’ Mixed Signals
June 27, 2019 A Five-Part Framework for Analyzing a Hot IPO Stock
June 20, 2019 Rate Cuts Closer to a Reality; What to Do About It
June 13, 2019 How to Take Advantage of the Gross Profitability Premium

Discussion
No comments have been added yet. Add your thoughts to the discussion!
You need to log in as a registered AAII user before commenting.
Create an account