

The Financial Markets’ Mixed Signals
by Charles Rotblut | July 11, 2019
One common investing adage is “the market is always right.” If you believe in efficient markets, meaning all known information is currently priced in, then you should agree with the adage. But what if the stock market and the bond market are sending different signals? Do you believe the stock market is right or do you listen to the bond market instead? It’s a quandary.
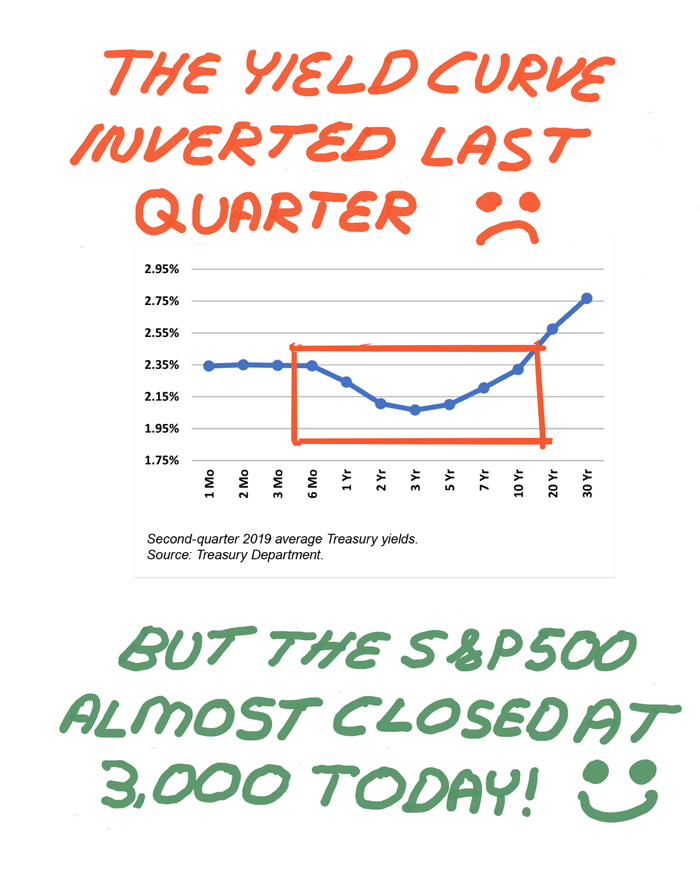 One commonly watched metric in the bond market is the yield curve. The yield curve plots the interest rates for U.S. Treasurys of different maturities. Under normal circumstances, the curve is upward-sloping. The upward slope reflects demands from investors who want higher rates of return for parting with their money over longer periods of time.
Last quarter, the yield curve was inverted. The average second-quarter yield on five-year Treasury notes was 25 basis points (0.25 percentage points) below the average yield of the three-month Treasury bill (2.10% versus 2.35%). The average yield on 10-year Treasury notes was three basis points (0.03 percentage points) below the average yield of the three-month Treasury bill (2.32% versus 2.35%). Put another way, you could have gotten a slightly higher yield by locking up your money for just a few months rather than several years.
Research conducted by Duke University professor Campbell Harvey found that prior yield curve inversions preceded recessions. The average length of lead time between the yield curve inverting on a quarterly basis and recession occurring has been 11 months; it is 12 months if the 2007–2009 global financial crisis is included. So the current inverted yield curve is a concern for those who pay attention to the bond market.
The stock market, on the other hand, is in the midst of a very good year. The S&P 500 index ended the first half of 2019 with an 18.5% gain and nearly closed above 3,000 for the first time today. Such price moves suggest optimism on the part of equity investors about corporate earnings. While current forecasts call for earnings to have declined in the second quarter, analysts’ tendency to underestimate and companies’ tendency to beat the consensus earnings estimates are well-documented. Plus, earnings growth is expected to resume in the third quarter and extend into 2020.
There are certainly arguments to be made for and against the possibility of a recession looming. Last week’s jobs report was good, but the Atlanta Federal Reserve’s GDPNow is now estimating second-quarter GDP growth to be just 1.4%. The Fed is widely expected to cut interest rates, but accommodative monetary policy isn’t keeping Europe’s economy from slowing. The trade war between China and the U.S. could get resolved or it could be dragged on even further. The list certainly could go on.
Also within the realm of possibilities is very slow economic growth but not an outright contraction. While a recession is often thought of as being at least two quarters of declining GDP, this is not how the National Bureau of Economic Research (NBER) defines it. Rather the NBER defines a recession as being “a significant decline in economic activity spread across the economy, lasting more than a few months, normally visible in real GDP, real income, employment, industrial production, and wholesale-retail sales.”
Furthermore, while the last two recessions were accompanied by big market drops—the tech bubble burst in 2000 and the global financial crisis of 2007–2009—the next economic slump, whenever it does occur, may be accompanied by a less severe drop in stocks. Most post-World War II bear markets have seen the S&P 500 fall by less than 30% before rebounding. These periods are not fun but financially tolerable for those who don’t panic and have their shorter-term cash needs covered. Plus, to the extent that the stock market is forward-looking, it could start recovering before the economic data points to a recovery being underway.
Then there is the big matter of forecasts. Nobody knows with certainty when the next bear market or recession will occur. Neither expansions nor bull markets die of old age. Unless you have soothsaying ability—and a better crystal ball than me—you run the risk of missing out on further market gains by acting on what you think might happen. If you’re nervous, consider maintaining an ongoing source to fund cash flow needs for the next two to five years. Doing so can help you avoid withdrawing from your portfolio during a downturn and may help you better cope with the uncertainty that always accompanies investing.

-
Bond Yields’ Role as a Recession Warning Signal – A few months ago, Campbell Harvey discussed his research into inverted yield curves, providing insights not commonly shared in the sound bites about the yield curve.
-
The Level3 Withdrawal Strategy to Maximize Your Long-Term Wealth – AAII founder James Cloonan developed a simple strategy that retirees could use to avoid taking withdrawals from their portfolios during down markets.
Pessimism among individual investors about the short-term direction of the stock market is at its lowest level since early May. The latest AAII Sentiment Survey also shows a rebound in neutral sentiment and a small rise in optimism.
Bullish sentiment, expectations that stock prices will rise over the next six months, edged up 0.5 percentage points to 33.6%. Though a small increase, it puts optimism at a nine-week high. Nonetheless, bullish sentiment is below its historical average of 38.5% for the 21st time this year.
Neutral sentiment, expectations that stock prices will stay essentially unchanged over the next six months, rose 4.4 percentage points to 38.9%. Neutral sentiment remains above its historical average of 31.0% for the 23rd time in 24 weeks.
Bearish sentiment, expectations that stock prices will fall over the next six months, fell 4.9 percentage points to 27.5%. Pessimism was last lower on May 8, 2019 (23.2%). This week’s decline puts bearish sentiment below its historical average of 30.5% for the first time in nine weeks.
All three indicators are currently within their typical ranges.
Many individual investors have been monitoring trade negotiations, particularly between the U.S. and China. The rebound in stock prices may have relieved some concerns about a steeper decline occurring, though others still anticipate a larger drop than what occurred this spring. Also having an influence are monetary policy, Washington politics (including President Trump), geopolitics, valuations, corporate earnings and the pace of economic growth.
Last week’s special question asked AAII members how the stock market’s performance during the first half of this year compared to what they expected back in January. Three-quarters (75%) of respondents say this year’s returns were better than they expected. Some of these respondents add that volatility was also higher than they anticipated. About 20% of all respondents say the market’s gains were matched with expectations.
Here is a sampling of the responses:
- “First-half 2019 performance was much more robust than I expected.”
- “More bullish than I expected, even though I was bullish in January.”
- “About on course. I’m a bit worried going forward due to talk of recession.”
- “I did not expect the volatility, but I expected the market to be up slightly.”
During the survey period leading up to the Fourth of July holiday, we asked AAII members what they most prefer to eat at barbecues. Hot dogs and hamburgers topped the list, picked by more than one-third of all respondents (38%). Ribs came in second at 19%, followed by corn at 13%.

Bullish: 33.6%, up 0.5 points
Neutral: 38.9%, up 4.4 points
Bearish: 27.5%, down 4.9 points
Bullish: 38.5%
Neutral: 31.0%
Bearish: 30.5%
June 27, 2019 A Five-Part Framework for Analyzing a Hot IPO Stock
June 20, 2019 Rate Cuts Closer to a Reality; What to Do About It
June 13, 2019 How to Take Advantage of the Gross Profitability Premium
June 6, 2019 The New SEC Rules Don’t Go Far Enough

Discussion
No comments have been added yet. Add your thoughts to the discussion!
You need to log in as a registered AAII user before commenting.
Create an account