

How to Take Advantage of the Gross Profitability Premium
by Charles Rotblut | June 13, 2019
A newer valuation measure continuing to be supported by academics is the gross profitability premium. First identified by University of Rochester professor Robert Novy-Marx, this anomaly favors stocks with high levels of gross profits scaled by assets. An article in the July Journal of Banking and Finance by Arizona State professor David Kenchington and his two co-authors found that mutual funds holding stocks with high levels of gross profitability outperform by a sizeable margin.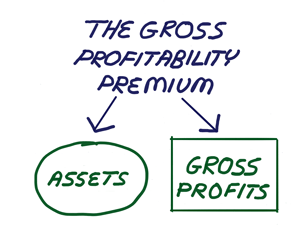
There’s a bit to unpack here, so I’ll start by explaining what the gross profitability anomaly is. It is the ratio of gross profits (revenues less cost of goods sold) to total assets. Rather than relying solely on the income statement, Novy-Marx tied profitability to the balance sheet. Doing so helps to analyze how effectively a company is using its assets to realize gross profits. (A bloated balance sheet will reduce the ratio.) Novy-Marx himself views gross profits as a growth indicator since net earnings can be “punished” for growth-related activities such as advertising and research & development.
Calculating the gross-profit-to-assets ratio is easy for a single stock. You simply need sales and cost of goods sold for the past 12 months (found at the top of the income statement) and total assets for the most recently reported quarter (found on balance sheet). Determining how one company’s gross profitability compares to others is trickier because the measure is not widely available. You would need to use a screener to gather the data on a large number of companies to determine the ranks. Using the same formula that my colleague Wayne Thorp previously used of (Gross income 12M/Total assets Q1)*100 on nonfinancial exchange-traded stocks with reported earnings for this current year, the top quintile of companies had gross profitability ratios of approximately 45 or higher. The table at the bottom of today’s commentary shows the stocks with the 10 highest gross profitability premium ratios.
The ratio is considered to be an anomaly because it contradicts the efficient market hypothesis (EMH). The pure form of EMH holds that stock prices reflect all known public information. If the market was completely efficient, then there shouldn’t be any performance advantage to buying stocks based on their gross-profit-to-assets ratio (or their valuation, size, price momentum, etc.). Yet, there is an advantage to doing so.
There is also an advantage to buying mutual funds focusing on the gross profitability premium. Mutual funds holding stocks whose gross-profit-to-assets ratios ranked in the top quintile (top 20%) realized a 1.96-percentage-point advantage in net annual returns over funds holding stocks whose gross-profit-to-assets ratios ranked in the bottom quintile. On a top-to-middle basis, funds targeting top quintile stocks outperformed funds holding middle quintile stocks (20% to 80% range of gros- profit-to-assets ratios) by 1.21 percentage points per year.
Unfortunately for those of you who want to know which funds these were, the study’s authors did not name them. They did give some clues as to where to look. Funds using this ratio tend to be younger, smaller, charge higher expense ratios, have higher levels of portfolio turnover and are more actively managed (as indicated by their comparatively lower R-squared values). Dimensional Fund Advisors (DFA) and AQR Capital Management were cited as having “incorporated measures similar to gross profitability in their trading strategies.” AQR Capital has some mutual funds and exchange-traded funds (ETFs) open to the general investing public, while DFA funds are only sold through select advisers. In all cases, you will have to look through the fund’s prospectus and materials to see whether the manager purposely incorporates the gross profitability premium.
As far as individual stocks are concerned, the list below is based on a screen of nonfinancial exchange-listed stocks with market capitalizations of at least $30 million. Novy-Marx’s research suggested that the factor was stronger among larger companies, while Kenchington et al. found it to work for both small-cap and large-cap funds. The list should be viewed as merely a starting point for further research.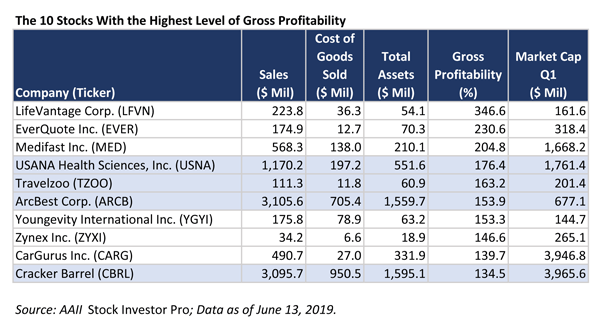

-
Screening for Quality Growth, Value & Momentum – In 2013, my colleague Wayne Thorp discussed the gross-profit-to-assets ratio in greater detail and gave instructions about how to incorporate it into a stock screen.
-
How to Take Advantage of Risk Factors – The gross profit premium is just one of a growing number of factors (“anomalies”). This article explains what you need to know about tilting your portfolio toward them.
Pessimism among individual investors about the short-term outlook for stock prices pulled back from its recent highs. Optimism rebounded in the latest AAII Sentiment Survey, though it is still unusually low.
Bullish sentiment, expectations that stock prices will rise over the next six months, rose 4.3 percentage points to 26.8%. Though at a four-week high, optimism is below 30% for the fifth consecutive week. It is also below its historical average of 38.5% for the 17th time this year.
Neutral sentiment, expectations that stock prices will stay essentially unchanged over the next six months, rebounded by 4.1 percentage points to 39.0%. The increase keeps neutral sentiment above its historical average of 31.0% for the 19th time in 20 weeks.
Bearish sentiment, expectations that stock prices will fall over the next six months, plunged 8.4 percentage points to 34.2%. Even with the drop, pessimism is above its historical average of 30.5% for the fifth consecutive week.
Optimism continues to be at an unusually low level (more than one standard deviation above/below its respective historical averages). The lower breakpoint between typical and unusual readings is 28.1%. Historically, unusually low levels of bullish sentiment have been followed by higher-than-median and higher-than-average six-month returns for the S&P 500 index.
Many individual investors have been monitoring trade negotiations, particularly between the U.S. and China. The recent rebound in stock prices may have relieved some concerns about a steeper decline in stock prices occurring, though others still anticipate a larger drop than we recently saw. Also having an influence are monetary policy, Washington politics (including President Trump), geopolitics, valuations, corporate earnings and the pace of economic growth.
This week’s special question asked AAII members for their current opinion of the so-called FANG stocks: Facebook, Apple, Netflix and Google-parent Alphabet. Forty-four percent of respondents express negative viewpoints. Many of these AAII members cite the risks of regulation, valuations and/or future competitive threats. Just under 20% of respondents have a positive outlook for the FANG stocks. About 13% of respondents are mixed, favoring some of the companies but cautious on others. Another 13% express a neutral opinion or say they don’t own/follow them.
Here is a sampling of the responses:
- “At risk of being broken up by regulators in the coming years.”
- “Great stocks. Subject to more risks than before, but they have years of growth ahead.”
- “I’m bullish on Apple and Alphabet, but neutral on Netflix and Facebook.”
- “More expensive than I care to deal with.”

Bullish: 26.8%, up 4.3 points
Neutral: 39.0%, up 4.1 points
Bearish: 34.2%, down 8.4 points
Bullish: 38.5%
Neutral: 31.0%
Bearish: 30.5%
June 6, 2019 The New SEC Rules Don’t Go Far Enough
May 30, 2019 Cherry-Picking Data to Make Active Managers Look Good
May 23, 2019 Are Any of the Nifty 50 Stocks Still Nifty?
May 16, 2019 Good Strategies Aren’t Always Intuitive, Plus Other Morningstar Conference Notes

Discussion
John from Florida posted over 7 years ago:
This working "ratio" is worth further investigation, on my part. I have never liked "Goodwill" and "Intangible Assets", on a Balance Sheet as being "productive". Appears this way of measuring efficient use of "assets" will lower the ratio for companies with large amounts of these "Unfriendly Assets (my term)". I will be looking at this approach more closely, and possibly using it to help me in future investment decisions. Thank you for publishing this article.
Mark from PA posted over 7 years ago:
Interesting ratio. It would be nice to create a stock screen that uses it.
You need to log in as a registered AAII user before commenting.
Create an account