

Rate Cuts Closer to a Reality; What to Do About It
by Charles Rotblut | June 20, 2019
It’s been nearly two years since I’ve last written about the Federal Open Market Committee’s (FOMC) forecasts. Yesterday’s updated projections warrant an update.
As has been widely discussed, the FOMC voted to leave interest rates unchanged. This was expected. Many Federal Reserve observers were looking for signs of rate cuts occurring during the second half of this year. They got it.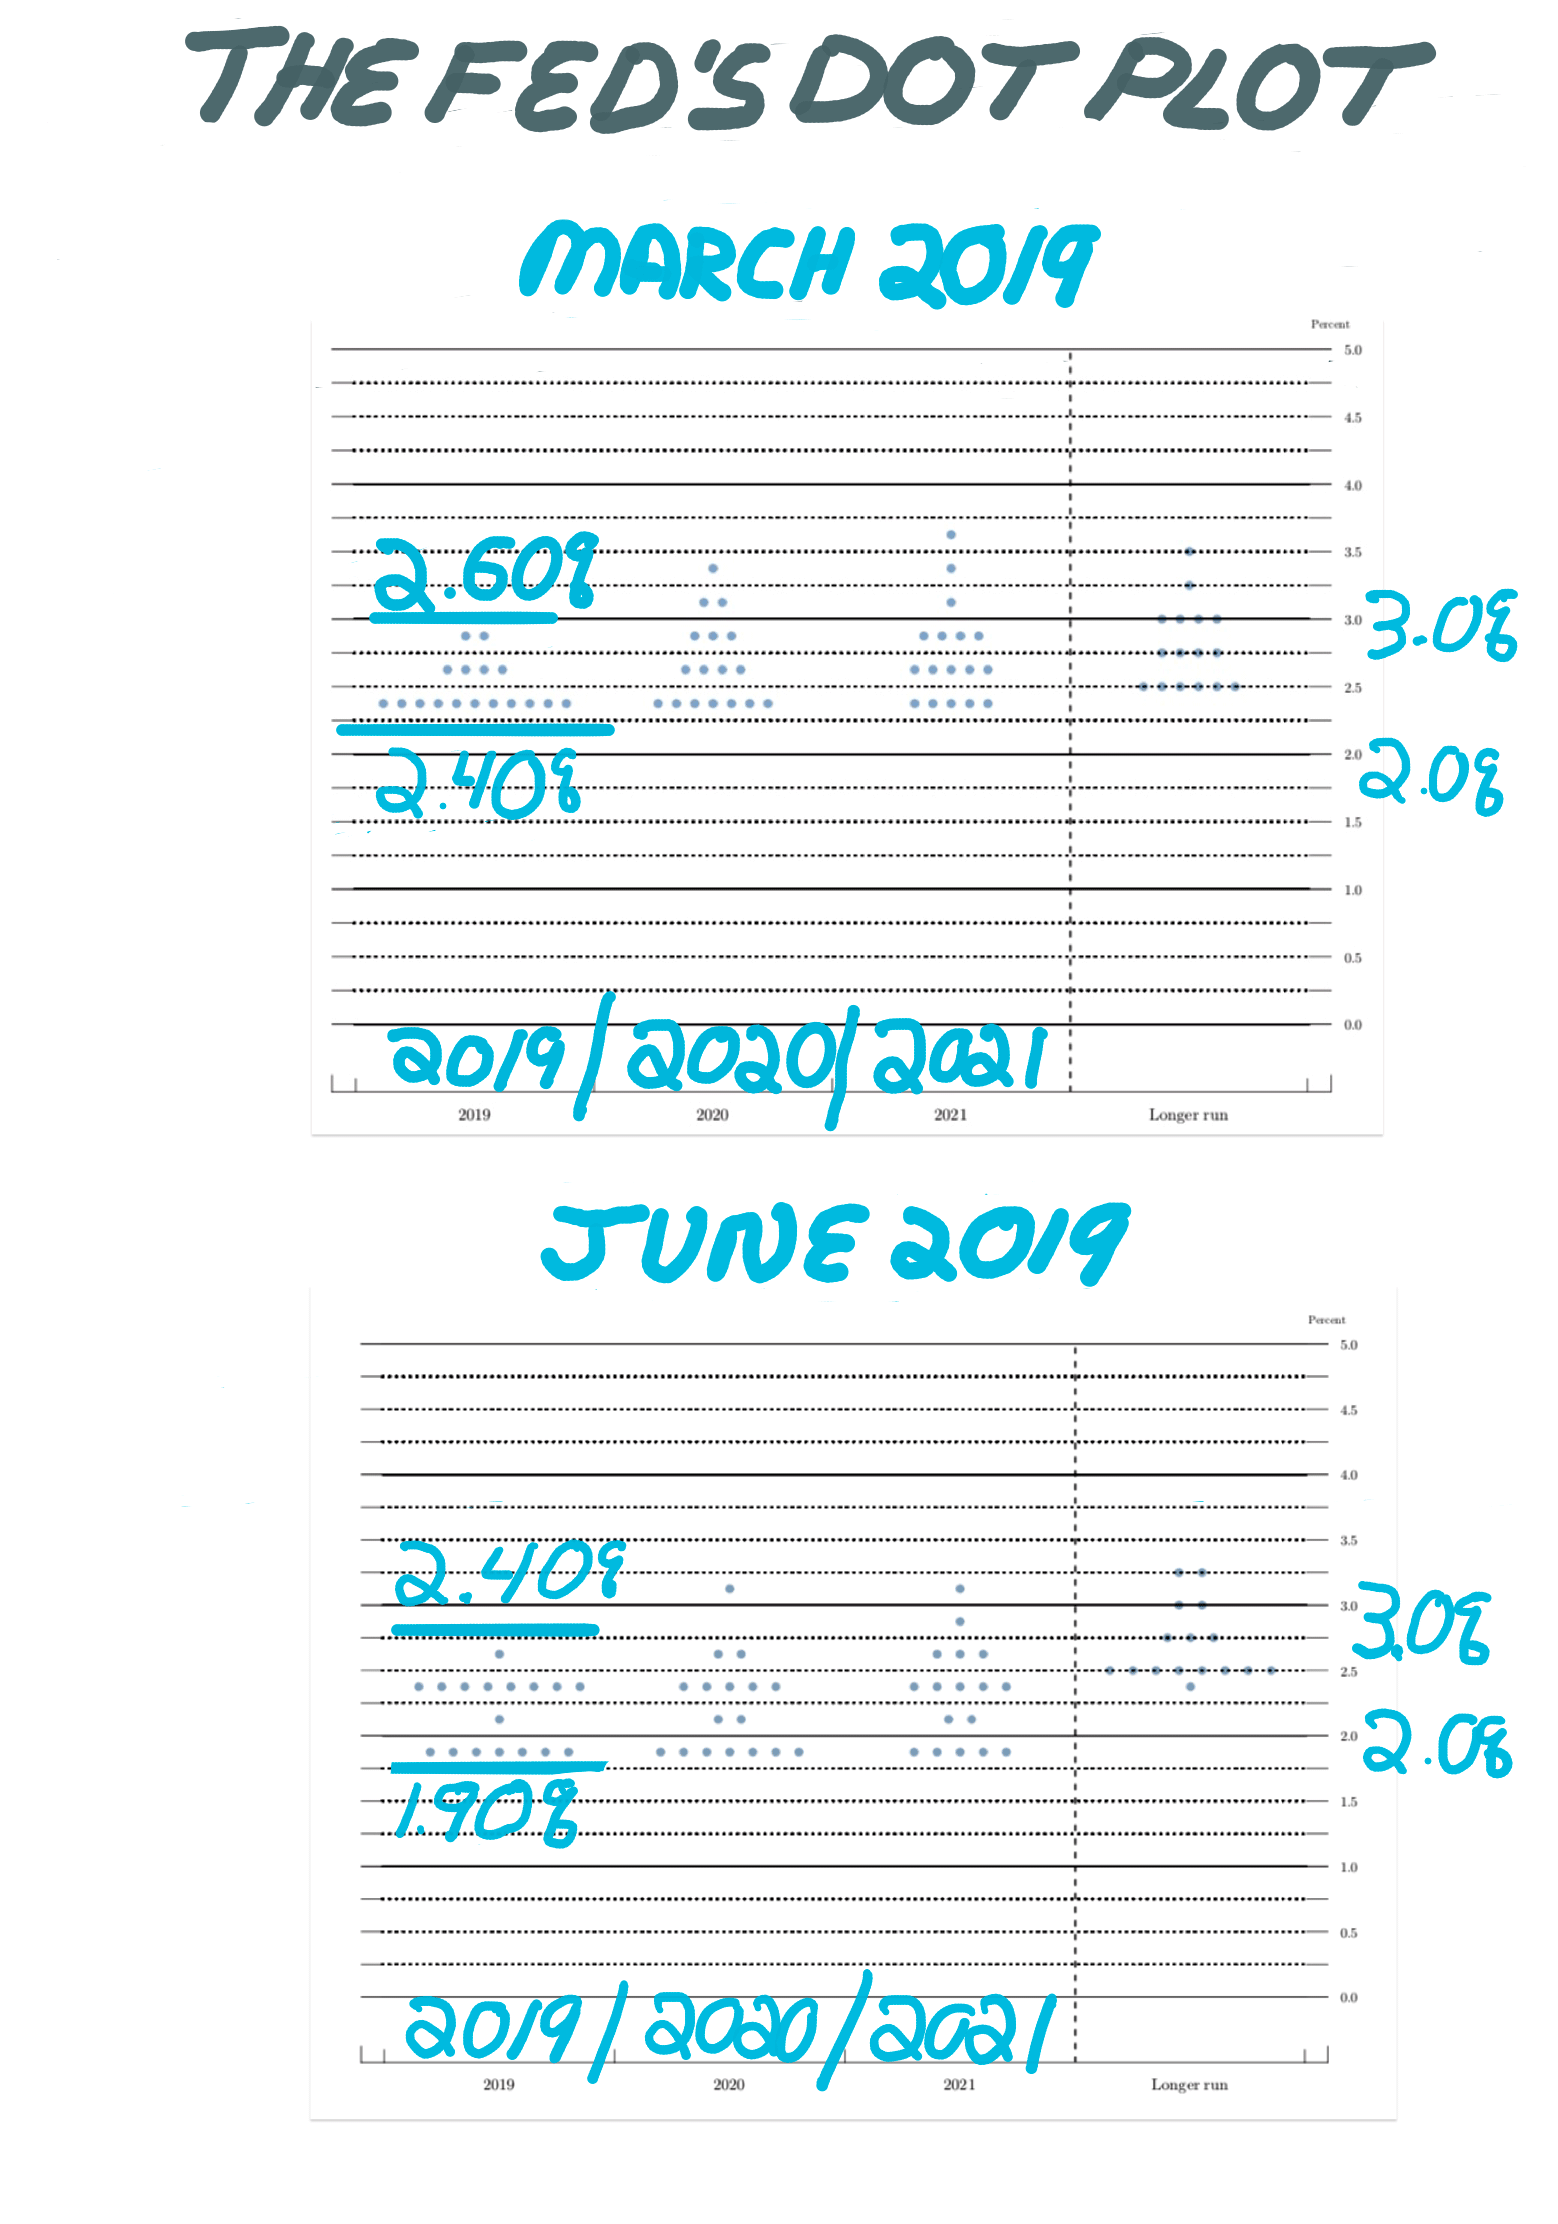
First, the meeting statement contained altered language about the committee’s intention regarding rate changes. The April/May meeting statement said, “the Committee will be patient as it determines” future adjustments to the federal funds rate. In contrast, yesterday’s statement said the Committee “will act as appropriate to sustain the expansion.”
Second, the dot plot changed. The dot plot—which is updated on a quarterly basis—charts the interest rate forecasts from each committee member. As you can see from the images on the right, the dots have been lowered. The central tendency range for fed funds rate (which excludes the three highest and three lowest forecasts) is now between 1.9% and 2.4%. In March—when the chart was last updated—the range was 2.4% to 2.6%. For 2020, the projected range is now 1.9% to 2.4% versus 2.4% to 2.9% three months ago. (Clicking on the charts will enlarge them.)
These changes move the dots in the direction we’ve been seeing priced into fed funds futures. The CME’s FedWatch Tool currently shows a 96% chance of interest rates being 50 basis points (0.50%) lower by the end of this year than they are now. The odds of rates being 75 basis points lower are currently at 65%. (These forecasts are very much subject to change.)
The bond market has been pricing in lower interest rates as well. The 10-year Treasury note closed today with a yield of 2.001%. To put the number in perspective, last November, the benchmark note yield was more than a full percentage point higher at 3.234%.
If you are a borrower, this is great news. If you’re a saver, it’s not. If you’re someone who made bets on bond yields rising sharply this decade, it’s a refutation. The bond market Armageddon some had previously called for is nowhere in sight. Rather, 3% continues to be a point of resistance for the 10-year note with only very brief periods of yields going modestly above this level occurring since the start of 2012.
As far as what you should do in response to all of this, the answer is not too much. The risks of making an error based on what you think might happen outweigh the risks of simply sticking to your long-term plan. Go back seven or eight years and look for forecasts calling for bond yields to be this low at the end of the current decade; good luck finding even one.
You can seek out higher interest rates on your cash savings. We have an affinity program with Discover Bank offering AAII members higher rates. If your cash is held in a brokerage account, review the options for sweep accounts and potentially for money market funds. On the bond side, laddering bond maturities can help offset interest rate risks. You can also ladder with defined-maturity bond funds; I’m working on an updated article about them. If you’re retired and are worried about what the FOMC’s lowered forecasts say about the economy, keeping a few years’ worth of planned withdrawals will help you weather any potential downturn in stocks. Our founder James Cloonan thinks keeping two to four years of retirement withdrawals in cash/safe short-term investments is a good idea regardless of what the Fed is doing.

-
Follow the Fed, but Be Smart About It – Small-cap stocks have historically thrived during periods of expansive monetary policy, while returns for large- and small-cap stocks are lower during restrictive periods.
-
Asset Returns During High and Low Inflationary Periods – Commodities, real estate and small-cap stocks have outperformed when inflation was high, as Craig Israelsen explains.
Optimism among individual investors about the short-term direction of stock prices continued to rebound but remains below 30% for the sixth consecutive week. The latest AAII Sentiment Survey also shows lower levels of neutral and bearish sentiment.
Bullish sentiment, expectations that stock prices will rise over the next six months, rose 2.7 percentage points to 29.5%. This is 18th time this year that optimism is below its historical average of 38.5%.
Neutral sentiment, expectations that stock prices will stay essentially unchanged over the next six months, declined 0.6 percentage points to 38.4%. Neutral sentiment is above its historical average of 31.0% for the 20th time in 21 weeks.
Bearish sentiment, expectations that stock prices will fall over the next six months, fell 2.1 percentage points to 32.1%. Pessimism is above its historical average of 30.5% for the sixth consecutive week.
Bullish sentiment is back within its typical range for the first time since early May. Neutral and bearish sentiment remain within their typical ranges.
The survey period runs from Thursday through Wednesday. Most of this week’s responses were recorded before yesterday’s Federal Open Market Committee (FOMC) meeting statement was issued.
Many individual investors have been monitoring trade negotiations, particularly between the U.S. and China. The recent rebound in stock prices may have relieved some concerns about a steeper decline in stock prices occurring, though others still anticipate a larger drop than we recently saw. Also having an influence are monetary policy, Washington politics (including President Trump), geopolitics, valuations, corporate earnings and the pace of economic growth.
This week’s special question asked AAII members what the most important qualities/characteristics they look for in a stock are. Slightly more than one out of three respondents (35%) say growth in revenues and/or earnings. Quality—including a company’s management, its financial strength and business stability—is listed by 27% of respondents. Nearly 23% of respondents seek out low valuations. Approximately 20% consider a stock’s chart pattern or its price momentum. Dividends, particularly growing dividends, are a top priority for 19% of respondents. Competitive advantages such as a moat are required by 11% of respondents. Several respondents list more than one attribute.
Here’s a sampling of the responses:
- “Dividend yield and dividend growth. I’m looking for above-average income growth.”
- “Growth. If the company is not growing, the stock price probably won’t grow either.”
- “A ‘moat,’ low or no debt, ongoing growth and a price within my current range for the stock.”
- “Relative strength in relation to the market.”

Bullish: 29.5%, up 2.7 points
Neutral: 38.4%, down 0.6 points
Bearish: 32.1%, down 2.1 points
Bullish: 38.5%
Neutral: 31.0%
Bearish: 30.5%
June 13, 2019 How to Take Advantage of the Gross Profitability Premium
June 6, 2019 The New SEC Rules Don’t Go Far Enough
May 30, 2019 Cherry-Picking Data to Make Active Managers Look Good
May 23, 2019 Are Any of the Nifty 50 Stocks Still Nifty?

Discussion
No comments have been added yet. Add your thoughts to the discussion!
You need to log in as a registered AAII user before commenting.
Create an account