

Spotting Dividend Warning Signs
by Charles Rotblut | July 25, 2019
Most conversations about dividends center around yield or growth. Equally important is a company’s ability to continue paying the dividend. Avoiding companies at risk of potentially cutting or suspending their dividend matters as much as finding ones capable of growing their dividend. The potential losses from owning a future dividend-cutter can far outweigh the quarterly payments you receive before the dividend is slashed or suspended.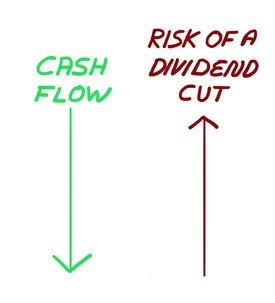
When discussing this topic, I believe it’s helpful to think about what dividends are: voluntary cash distributions of profits. When viewed from this perspective, three things stand out. First, there needs to be enough free cash flow to pay the dividend. Second, whether there is a risk of the company’s debtors pressuring the company to cut or suspend its dividend is a consideration. Finally, it’s good to try and identify what the company’s intent is for the dividend.
Since dividends are cash payments, a company’s cash flow matters greatly. A metric I look at for all companies—regardless of if they pay a dividend or not—is cash from operations. This is the amount of cash realized from or used by normal business operations. It should routinely be positive. If it’s negative for more than one quarter, the dividend is at risk. If it’s negative for just one quarter, investigate. A company may have loaded up on inventory or had a large amount of unpaid customer bills (accounts receivable) due to the timing of orders. The answers will be provided in either the annual (10-K) or quarterly (10-Q) U.S. Securities and Exchange Commission (SEC) filing.
While on the cash flow statement, calculate free cash flow. Defined as cash from operations minus capital expenditures (capex), this number tells you how much cash is available after accounting for spending on things such as facilities and equipment. If it’s negative, it could be a potential sign that the company is unable to cover its dividend. Again, investigate a single occurrence of negative cash flow since it might reflect one-time expenditures.
Utilities may have modest levels of negative free cash flow because of their ability to recoup the cost of expenditures on power plants, transmission equipment, etc. For our Dividend Investing (DI) newsletter, a stock’s free-cash-flow payout ratio is considered. It shows how much cash a company is paying in dividends as a percentage of free cash flow.
When it comes to laying claim on cash and other assets, debtholders have priority over shareholders. This mere fact makes it important to consider a company’s ability to service its debt payments. I personally use the Z double prime score to assess a company’s risk of having significant financial distress. Developed by New York University professor Robert Altman, this ratio considers working capital, retained earnings, earnings before interest and taxes (EBIT) and equity relative to debt. Low scores are a big warning sign. (In the More on AAII.com section below, I’ve included a link to an article about the score. It’s not difficult to calculate the Z-Score.)
Another and more commonly available metric is the interest coverage ratio (earnings before interest and taxes divided by interest expense). Numbers below 1.0 indicate that profits are not covering interest payments. Look at the trend as well. A declining interest coverage ratio could put the company at risk of violating its debt covenants, thereby creating pressure from debtholders to reduce the dividend.
Management’s intent to continue paying the dividend can require a more subjective judgment. A good place to start is to look at the company’s recent earnings conference call transcripts (available on SeekingAlpha.com; type in a ticker symbol, click on earnings and then transcripts). Scan for any comments made about the dividend, the payout ratio, cash flow or debt. Then go to the company’s investor relations website (simply type “[company’s name] investor relations” into Google or another search engine). Review recent presentations for similar types of comments. Finally, look at the company’s past dividend history. If it has cut dividends in the past, it may be willing to do so in the future.
Even if a company passes all of the above tests, it still might end up cutting its dividend. Similarly, a company might fail one or more of the above tests and never cut its dividend. The goal is not to predict the future of the dividend with absolute certainty, but rather to simply reduce the odds of getting burned by a cut or suspended dividend.
Of course, the ideal situation is to find attractive stocks with cash flow, fiscal strength and management intent to grow their dividend. Those are the type of stocks we seek for our Dividend Investing newsletter.
(For those of you who are interested in learning more about the newsletter, my colleague Derek Hageman has published a special report highlighting five stocks meeting the DI criteria. It’s part of a special $1 AAII Dividend Investing promotion we’re running this week.)

-
Using the Z-Score to Assess the Risk of Bankruptcy – The creator of the financial distress indicator explains how to calculate and use it.
-
Dividend Safety Signs and Warning Flags – This 2009 article by former AAII Journal editor Maria Crawford-Scott provides additional indicators to monitor.
Individual investors’ optimism about the short-term direction of stocks reversed its recent gains, falling to a four-week low. The latest AAII Sentiment Survey also shows increases in pessimism and neutral sentiment.
Bullish sentiment, expectations that stock prices will rise over the next six months, fell by 4.2 percentage points to 31.7%. Optimism is below its historical average of 38.5% for the 11th consecutive week and the 23rd time this year.
Neutral sentiment, expectations that stock prices will stay essentially unchanged over the next six months, rose by 0.8 percentage points to 36.2%. The modest increase keeps neutral sentiment above its historical average of 31.0% for the 25th time in 26 weeks.
Bearish sentiment, expectations that stock prices will fall over the next six months, rose 3.4 percentage points to 32.0%. The increase puts pessimism above its historical average of 30.5% for the ninth time in 11 weeks.
All three indicators are currently within their typical ranges.
Many individual investors have been monitoring trade negotiations, particularly between the U.S. and China. The rebound in stock prices may have relieved some concerns about a steeper decline occurring, though others still anticipate a larger drop than what occurred this spring. Also having an influence are Washington politics (including President Trump), geopolitics, valuations and corporate earnings. Perceptions of the pace of economic growth, along with monetary policy, interest rates and valuations are also playing in a role.
This week’s special question asked AAII members how the recent highs set by the Dow Jones industrial average and the S&P 500 index have influenced their sentiment toward stocks. Responses were mixed. Nearly 29% describe themselves as being more pessimistic, particularly because of prevailing valuations. An additional 18% are now cautious. Conversely, 14% are more optimistic and expect stocks to continue rising. About 26% say the new highs aren’t having an influence either because they are more focused on other factors or because they follow long-term strategies.
Here is a sampling of the responses:
- “I’m less optimistic about future growth and am more cautious.”
- “I’m more optimistic about future growth and will continue to invest.”
- “It has not. Just market ups and downs. My plans remain on course.”
- “Prices are too high relative to earnings expectations. Trees don’t grow to the sky.”

Bullish: 31.7%, down 4.2 points
Neutral: 36.2%, up 0.8 points
Bearish: 32.0%, up 3.4 points
Bullish: 38.5%
Neutral: 31.0%
Bearish: 30.5%
July 18, 2019 How the VMQ Stocks Momentum Indicator Was Changed
July 11, 2019 The Financial Markets’ Mixed Signals
June 27, 2019 A Five-Part Framework for Analyzing a Hot IPO Stock
June 20, 2019 Rate Cuts Closer to a Reality; What to Do About It

Discussion
No comments have been added yet. Add your thoughts to the discussion!
You need to log in as a registered AAII user before commenting.
Create an account