

The Latest Enhancements to AAII.com
by Charles Rotblut | May 02, 2019
As I mentioned in March, we are in the process of making our website an even better resource for individual investors than it is now. Rather than waiting to roll out all of the changes at once, we are making them available incrementally, so you don’t have to wait. This week, I explain what we’ve done recently and share some insights about what we’re still working on.
My primary focus is on the Stock Ideas section. As the name implies, this a useful resource for those of you who prefer to invest in individual stocks. It contains our nearly 60 stock screening strategies plus a new stock evaluator.
One of the biggest changes is the new ideas we’re showing in the section. We’ve integrated ideas from all four of our model stock portfolios. AAII members can now see the latest changes made to the Model Shadow Stock Portfolio directly on this page. We’re also showing the five stocks with the lowest valuations meeting the portfolio’s buy rules on this page. (AAII members can see the full list of passing companies. Daily updates to the Shadow Stock’s list of stock ideas will be available very soon.) You can also now see a sampling of stock ideas from our AAII Dividend Investing (DI), Stock Superstars Report and VMQ Stocks premium portfolios, updated Tuesday through Saturday.
Each of these newsletters follows a different approach and the stock ideas shown reflect this. DI Ideas are shown both by highest yield and strongest dividend growth. Superstars Ideas are shown by price momentum, price-earnings ratio, PEG ratio and dividend-adjusted PEG ratio. VMQ Ideas are shown by lowest Value Score and highest Momentum Score.
Want more ideas? We’re now regularly featuring a screening strategy. You can learn more about it and see the list of passing companies, which is updated daily. Stock Investor Pro subscribers now have the option of either downloading daily data updates to the software (great for customized screens and views) or seeing the latest stocks passing the 59 strategies directly on AAII.com.
Our strategies are divided into “gurus” and “factors.” The guru screening approaches are those based on the philosophies of famous investors, such as Benjamin Graham, David Dreman, John Neff, William O’Neil and James O’Shaughnessy. The factor screening methodologies are quantitively driven, focusing on earnings estimate revisions, the highest yielding stocks in the Dow Jones industrial average (aka, the so-called “Dogs of the Dow”) and stocks with high levels of profitability.
If you want to know whether a particular stock you follow passes one of our screens, use our new Stock Evaluator. It will tell you which strategies the stock passes. For instance, Merck & Co. (MRK) passed our Dogs of the Dow Screen as of April 30, 2019. If the stock does not pass any of the strategies, you see a list of its industry peers that passed the most screens.
We’re not done improving AAII.com. Among the additional enhancements we’re working on are new mutual fund and exchange-traded fund (ETF) tools, as well as a brand new portfolio tool. Other sections of the website are also being worked on to make them even more useful. Stay tuned!

-
Five Common Traits of Successful Value Screens – Though investing gurus differ in what they look for in a stock, there are five common traits we see across the AAII value-oriented screens.
-
Constructing Winning Stock Screens – In this 2012 AAII Journal article, AAII president John Bajkowski explains how a stock screen can be created to identify companies matching an individual’s investing objective and style.
Optimism about the short-term direction of the stock market rebounded in the latest AAII Sentiment Survey as neutral sentiment receded from its recent high. Pessimism stayed within its recent range.
Bullish sentiment, expectations that stock prices will rise over the next six months, rebounded by 5.5 percentage points to 39.0%. The rise puts optimism a bit above its historical average of 38.5%.
Neutral sentiment, expectations that stock prices will stay essentially unchanged over the next six months, pulled back by 6.7 percentage points to 39.6%. The drop follows last week’s three-year high. Even with the lower reading, neutral sentiment remains above its historical average of 31.0% for the 14th consecutive week and the 15th time in 17 weeks.
Bearish sentiment, expectations that stock prices will fall over the next six months, rose 1.2 percentage points to 21.3%. Pessimism is below its historical average of 30.5% for the seventh consecutive week and the 12th time in 13 weeks.
Above-average readings for bullish sentiment continue to be infrequent. This week’s reading was just the sixth this year to exceed the historical average of 38.5%. Meanwhile, pessimism is currently in a tight four-week range with readings fluctuating between 20.2% and 21.8%.
At current levels, all three indicators are within their typical ranges. Neutral sentiment is near its upper end while bearish sentiment is close to its lower end.
The survey period runs from Thursday through Wednesday. As such, most of this week’s votes were recorded before the Federal Open Market Committee’s (FOMC) meeting statement was released.
This week’s special question asked AAII members how the recent return of the S&P 500 index and the Nasdaq composite to record highs is influencing their sentiment toward stocks. Approximately one of four respondents (25%) say the recent highs aren’t having an effect. Many of these respondents describe themselves as being long-term investors or otherwise sticking to a definable strategy. Slightly more than 16% of respondents expect stock prices to continue rising. A similar percentage of respondents describe themselves as being more cautious. Nearly 14% view stocks as being overvalued and another 14% think stocks are more likely to drop than rise.
Here is a sampling of the responses:
- “I am a long-term investor and therefore my holdings are not influenced by these record highs.”
- “Makes me more cautious in buying.”
- “Good time to sell. It’s a tough time to find bargains to buy.”
- “I think stocks are overvalued and a correction is bound to happen.”
- “Still bullish. There is still plenty of skepticism and little euphoria.”

Bullish: 39.0%, up 5.5 points
Neutral: 39.6%, down 6.7 points
Bearish: 21.3%, up 1.2 points
Bullish: 38.5%
Neutral: 31.0%
Bearish: 30.5%
AAII Asset Allocation Survey
Individual investors’ exposure to cash fell to a 13-month low last month. The April AAII Asset Allocation Survey also showed higher equity allocations and a slight decline in fixed-income allocations.
Stock and stock fund allocations rebounded by 2.4 percentage points to 67.8%. This was the largest exposure to equities since last October (69.5%). Last month was also the 73rd consecutive month with equity allocations above their historical average of 61.0%.
Bond and bond fund allocations declined 0.3 percentage points to 17.1%. Fixed-income allocations remained above their historical average of 16.0% for the third time in four months.
Cash allocations fell by 2.2 percentage points to 15.1%. This was the lowest level since March 2018 (14.7%). Cash allocations were also below their historical average of 23.0% for the 89th consecutive month.
New record highs for the stock market helped to boost the value of individual investors’ equity holdings. Pessimism about the short-term direction of the stock market in our weekly Sentiment Survey was also low throughout much of the month. Many AAII members follow a long-term approach to investing. Differences in which members take the survey each month may impact the results.
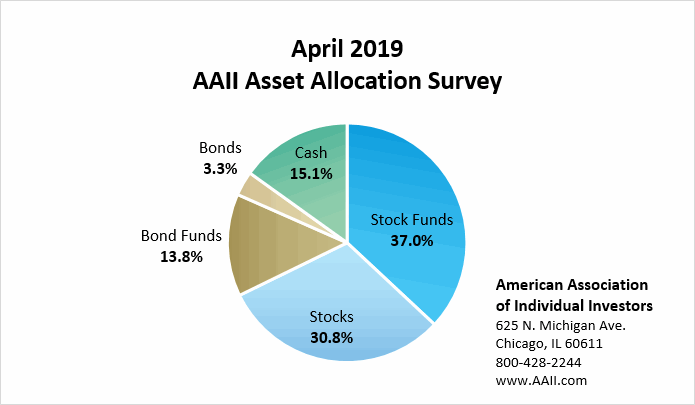
April AAII Asset Allocation survey results:
- Stocks and stock funds: 67.8%, up 2.4 percentage points
- Bonds and bond funds: 17.1, down 0.3 percentage points
- Cash: 15.1%, down 2.2 percentage points
April AAII Asset Allocation survey details:
- Stocks: 30.8%, up 0.2 percentage points
- Stock Funds: 37.0%, up 2.2 percentage points
- Bonds: 3.3%, down 0.2 percentage points
- Bond Funds: 13.8%, unchanged
Historical Averages:
- Stocks/Stock Funds: 61.0%
- Bonds/Bond Funds: 16.0%
- Cash: 23.0%
The numbers are rounded and may not add up to 100%.
The AAII Asset Allocation Survey has been conducted monthly since November 1987 and asks AAII members what percentage of their portfolios are allocated to stocks, stock funds, bonds, bond funds and cash. The survey and its results are available online at: www.aaii.com/investor-surveys.
Want to weigh in? Take the survey yourself and see results online at www.aaii.com/assetallocationsurvey
If you want to become an effective manager of your own assets and achieve your financial goals, consider a risk-free 30-day Trial AAII Membership.
- Stocks and Stock Funds: 67.8%, up 2.4 percentage points
- Bonds and Bond Funds: 17.1%, down 0.2 percentage points
- Cash: 15.1%, down 2.2 percentage points
- Stocks: 30.8%, up 0.2 percentage points
- Stocks Funds: 37.0%, up 2.2 percentage points
- Bonds: 3.3%, down 0.2 percentage points
- Bond Funds: 13.8%, up 0.0 percentage points
- Stocks/Stock Funds: 62.0%
- Bonds/Bond Funds: 16.0%
- Cash: 22.0%
Take the Asset Allocation Survey.
April 25, 2019 My Personal Portfolio Four Months After Correction
April 18, 2019 Six Measures for Comparing Funds
April 11, 2019 Active ETFs With Special Risks
April 4, 2019 Five Concepts Financially Literate Investors Understand

Discussion
No comments have been added yet. Add your thoughts to the discussion!
You need to log in as a registered AAII user before commenting.
Create an account