

The Value Premium’s Not Dead, but It Is Smaller
by Charles Rotblut | February 13, 2020
One of the longest-standing factors for stocks is value. Over the long term, value stocks have outperformed both growth stocks and the market. This outperformance is known as the value premium. It is the difference between the return of a value stock portfolio and the return of a market portfolio.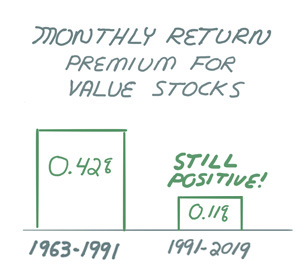
The premium is most associated with book value because of Eugene Fama and Kenneth French’s frequently cited 1992 Journal of Finance paper, “The Cross-Section of Expected Stock Returns.” The paper found that stocks with high book-to-market (BM) ratios (value stocks) outperformed stocks with low book-to-market ratios (growth stocks) over the period of July 1963 to June 1991. Put in terms more familiar to most investors, a broad portfolio of stocks with low price-to-book ratios (the inverse of book-to-market ratio) realized higher returns than a broad portfolio of stocks with high price-to-book ratios.
The average monthly value premium for value stocks was 0.42%. The average premium for growth stocks was –0.07%. In other words, value stocks outperformed a market portfolio by about 5% per year. Growth stocks lagged a market portfolio by almost a full percentage point per year.
Since then, the data has changed. Over the period of July 1991 through June 2019, the average monthly value premium shrunk to 0.11% (or 1.3% per year). The average monthly growth premium improved to 0.01% (or 0.12% per year). So, while the value premium did become considerably smaller, it didn’t die and go away.
In a recently published paper, Fama and French chose to examine the latter period (1991 through 2019) to respond to assertions about a post-publication elimination of the value premium. When an anomaly or strategy is publicized, such as through the publication of a study in an academic journal, its outperformance can disappear afterward. This occurs from too many investors trying to put the findings to work in their own portfolios and/or arbitragers attempting to lock in the identified premium by taking both sides of the trade. While popularity has advantages for one’s social life, it is bad for investment strategies.
What they found was not fully conclusive. The value premium did decrease over the second period—Fama and French acknowledge this. Volatility was blamed as being a “culprit.” The two professors elaborated, “The high volatility of monthly value premiums clouds inferences about whether the declines in average premiums reflect changes in expected premiums.” After accounting for changes in market conditions, their statistical analysis found that “noise in the coefficient estimates rules out confident inferences about whether or how much conditional expected premiums change from 1963–1991 to 1991–2019.”
Even with the uncertainty and shrinking premiums, there are still reasons to believe in value. The value premium did not go away. It remains stronger and more significant for small companies, with a monthly average premium of 0.33% for the 1991 to 2019 period. Regardless of size, the premium for growth stocks remains close to zero.
Value also offers some diversification benefits. The correlation of value stocks to a broad market period is 0.84 for large value stocks and 0.82 for small value stocks over the period of July 1963 through June 2019. For growth stocks, the correlations are 0.97 and 0.87, respectively. (A correlation of 1.0 implies returns move together, while a correlation of –1.0 implies returns move in opposite directions.) The reason correlations are larger for growth stocks is because large growth stocks have accounted for 51.9% of the market portfolio while large value stocks have accounted for just 13.9%.

-
Value Investing’s Differing Short- and Long-Term Performance Record – I looked at value’s more recent performance and found the story to be more nuanced than the headlines suggest.
-
AAII Shadow Stock Portfolio – Our Model Shadow Stock Portfolio is based on Fama’s and French’s research. It is a real-life example of how individual investors can use the value and size premiums to their advantage.
The percentage of individual investors describing their short-term outlook as “neutral” rose to a five-week high in the latest AAII Sentiment Survey. Optimism also rose while pessimism plunged.
Bullish sentiment, expectations that stock prices will rise over the next six months, jumped 7.5 percentage points to 41.3%. The increase puts optimism above its historical average of 38.0% for the third time in five weeks.
Neutral sentiment, expectations that stock prices will stay essentially unchanged over the next six months, rebounded by 1.4 percentage points to 32.3%. The historical average is 31.5%.
Bearish sentiment, expectations that stock prices will fall over the next six months, fell 8.8 percentage points to 26.4%. Though a large drop, it only puts pessimism at a three-week low. The historical average is 30.5%.
All three indicators are currently within their typical historical ranges.
The coronavirus outbreak is dampening the economic outlook for some but not all individual investors. Also affecting individual investor sentiment is the market’s upward trend, valuations, the phase-one trade deal between the U.S. and China, the November elections, Washington politics, earnings growth, monetary policy and the economy.
In this week’s special question, we asked AAII members to elaborate on their comfort level with current stock valuations. A little less than half of respondents (45%) state that they are slightly concerned with current stock valuations. This compares to 32% of respondents who state that they are very concerned with current valuations. In these two groups, many cited high price-earnings (P/E) ratios and uncertainty of corporate earnings growth as reasoning for their concern. Conversely, 20% of respondents state that they are comfortable with current valuations given the low interest rate environment.
Here is a sampling of the responses:
- “Valuations are presently stretched beyond earnings growth. The bond market has demonstrated an inverted yield curve, albeit short-lived, and that can signal a recession in the near future.”
- “The current level after 11 years of rising values makes one think seriously about allocation, but I’m still comfortable having 60% in equities.”
- “Progressively lower [comfort level] as reported earnings will show less growth and jobs growth will slow. When Tesla crashes from its overexuberant height, the market will panic.”
- “More confident than ever, the U.S. is the best global place to invest the world’s trillions. Also, more U.S. workers equals more 401(k) contributors, which means higher market valuations.”

Bullish: 41.3%, up 7.5 points
Neutral: 32.3%, up 1.4 points
Bearish: 26.4%, down 8.8 points
Bullish: 38.5%
Neutral: 31.0%
Bearish: 30.5%
February 6, 2020 Nine Observations About Tesla’s Crazy Ride
January 30, 2020 Optimism Was Low Last Year, But Individual Investors Stayed With Stocks
January 23, 2020 Despite the Headlines, Mr. Market Is Quite Content
January 16, 2020 The New Features We’ve Added to Our Website

Discussion
Thomas Kraemer from Washington posted over 6 years ago:
Thank you for the important Fama and French update on the value premium, and for the link to the free download of the original paper.
You need to log in as a registered AAII user before commenting.
Create an account