

Yield's Role as a Valuation and Risk Indicator
by Charles Rotblut | February 20, 2020
Yield is commonly viewed from the standpoint of income. It’s a measure of how much cash you can expect to receive from an investment, such as a stock. Yield has other uses, particularly as a measure of valuation and a measure of risk.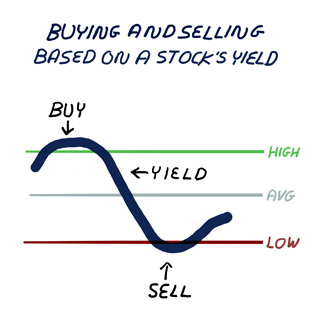
An inverse relationship exists between yield and valuation. High yields signal lower valuations whereas low yields signal higher valuations. This is the opposite of many other valuation indicators used by individual investors, such as the price-earnings (P/E) ratio. The difference is due to how both are calculated. In the case of dividends, yield is calculated by dividing dividends by price (D/P). With the price-earnings ratio—and other similar ratios—price appears in the numerator with the calculation being price divided by earnings.
Low valuations have historically been associated with higher returns. Some stocks are cheap for a reason, however. This is where yield’s role as an indicator of risk can come into play. Investors commonly demand a higher yield when they perceive a high level of risk. An elevated yield may simply reflect concerns about future growth or prevailing business conditions. A (very) high yield may signal risk about the company’s ability to continue paying a dividend.
This is why you should not pick a stock on the basis of yield alone. The few extra points of yield you reach for could be more than offset by a drop in the stock’s price. Consider a scenario where you have two stocks, each priced at $100. Stock A has a yield of 2%—a little above the current market yield—while stock B yields 6%. On the surface, stock B’s higher yield might seem attractive, but if its total return (price return plus dividend yield) lags stock A’s total return by a margin greater than four percentage points, you would have been better off holding stock A. It doesn’t take much to tip the scales in favor of stock A.
Of course, the challenge is determining which stock will perform better. For AAII’s Dividend Investing (DI) portfolio, this is done by considering a stock’s relative yield, the likelihood of it continuing to grow its dividend and its underlying financial strength. Combined, all three pillars indicate whether the current yield reflects a bargain or a risky stock that should be passed up.
On the valuation front, a stock’s yield is compared to what investors have historically demanded. A seemingly attractive yield may not be so attractive if it’s well below the five-year average. A lower yield could be attractive if it’s above the five-year average. Consider WEC Energy Group (WEC) and Home Depot Inc. (HD), the latter of which is currently held in the Dividend Investing portfolio. WEC Energy’s current yield of 2.5% compares to a five-year average yield of 3.0%. Home Depot’s current yield of 2.2% compares to a five-year average yield of 1.8%. In this comparison, Home Depot has the cheaper relative valuation even though its absolute yield is lower. WEC Energy was removed from the DI portfolio last year because its yield had fallen to too low of a relative level. It was a case of a good company with an unattractive valuation.
For growth, whether a company has a history of growing its dividend and the intent to continue doing so is looked at. Factors such as sales and earnings growth are also considered. They not only factor into the ability to grow the dividend but also provide a catalyst to drive the stock price higher. For stocks, income is nice but total return is better.
On the fundamental side, the cash flow is paid attention to. A company generating positive cash flow is more valuable than one that isn’t. When cash flow isn’t positive, not only is the dividend at risk but so is the stock’s price. If investors suspect cash flow problems, they’ll demand a higher yield as compensation—preferring to get paid now rather than risk not getting anything in the future. This is why you shouldn’t pick stocks based on yield alone; always dig deeper to determine whether the stock is truly a good bargain.

-
Dividend Safety Signs and Warning Flags – Specific ratios and figures you can look at to judge how likely it is that a company’s dividend will continue to be paid.
-
Calculating Intrinsic Value With the Dividend Growth Model – In addition to yield, you can also use expected future dividends to determine whether a stock is under- or overvalued.
Optimism among individual investors about the short-term direction of the stock market stayed above 40%, albeit barely, for the second consecutive week in the latest AAII Sentiment Survey. Pessimism rebounded while neutral sentiment declined.
Bullish sentiment, expectations that stock prices will rise over the next six months, decreased by 0.8 percentage points to 40.6%. Optimism is above 40% on back-to-back weeks for the fourth time in 16 weeks. The historical average is 38.0%.
Neutral sentiment, expectations that stock prices will stay essentially unchanged over the next six months, pulled back by 1.5 percentage points to 30.8%. The drop puts neutral sentiment below its historical average of 31.5% for the fifth time in six weeks.
Bearish sentiment, expectations that stock prices will fall over the next six months, rose 2.3 percentage points to 28.7%. Even with the increase, pessimism is below its historical average of 30.5% for the 16th time in 18 weeks.
All three indicators are currently within their typical historical ranges.
Prior to November 6, 2019, and November 13, 2019, bullish sentiment has not been above 40% on back-to-back weeks since August 2018. Whether the recent change represents a shift toward a more consistent streak of near- and above-average optimism remains to be seen.
The COVID-19 (coronavirus) outbreak has dampened the economic outlook for some but not all individual investors. Also affecting individual investor sentiment is the market’s upward trend, valuations, the phase-one trade deal between the U.S. and China, the November elections, Washington politics, earnings growth, monetary policy and the economy.
For this week’s special question, we asked AAII members to share their thoughts about the S&P 500 index setting further record highs this year. Approximately 43% of respondents state that they believe the market will pull back and not set new highs. Many in this group cite unsustainably high valuations as their reasoning. Conversely, 30% of respondents state that, given the low-interest-rate environment, they believe the S&P 500 will continue to climb during the year. Additionally, 19% state that the market will climb in the short term then taper off as the year progresses, while 8% are unsure whether the current trend of new highs will continue.
Here is a sampling of the responses:
- “As long as interest rates remain low, and Federal Reserve chair Jerome Powell has indicated his desire for that, only declining earnings would likely cause a market reversal. I don’t see that in the cards.”
- “How can the outlook for stocks be for high percentage gains when the 30-year bond trades at 2%?”
- “I see generally good earnings reports but some flattening of forecasts. Together with the uncertainty of the elections and the coronavirus, I think optimism will be suppressed.”
- “It is in the current administration’s interest to keep markets up during this election cycle.”

Bullish: 40.6%, down 0.8 points
Neutral: 30.8%, down 1.5 points
Bearish: 28.7%, up 2.3 points
Bullish: 38.5%
Neutral: 31.0%
Bearish: 30.5%
February 13, 2020 The Value Premium’s Not Dead, but It Is Smaller
February 6, 2020 Nine Observations About Tesla’s Crazy Ride
January 30, 2020 Optimism Was Low Last Year, But Individual Investors Stayed With Stocks
January 23, 2020 Despite the Headlines, Mr. Market Is Quite Content

Discussion
No comments have been added yet. Add your thoughts to the discussion!
You need to log in as a registered AAII user before commenting.
Create an account