


Related

Exchange-Traded Funds
Monthly updates and grades for returns, risk and expense ratio top the improvements to our ETF guide this year.
Charles Rotblut leads a class in AAII's new Essential Investing Video Course. Go to https://www.aaii.com/ves for more information and to subscribe.
The addition of new exchange-traded fund (ETF) tools and features to AAII.com, as well as a new quarterly column, is leading to a further revamping of our annual guide to exchange-traded funds.
One change carried over from last year’s guide is the use of Morningstar’s ETF categories. Morningstar’s categories are more nuanced in terms of describing the type of strategy a fund is designed to follow. For instance, a fund primarily holding large-cap stocks no longer simply belongs to the large-cap category. Instead, it is categorized as a large blend, a large growth or a large value fund. A big advantage of the switch is that it has allowed us to develop features for AAII members as well as provide more frequently updated data. It also allows us to consider moving the timing of this annual guide to February to coincide with the publication of our annual mutual fund guide.
One of the ways we’re using the updated data is providing quarterly updates on ETFs in the AAII Journal. We introduced the Quarterly ETF Update in the May 2020 issue and the second edition can be read here. These updates show the best- and worst-performing ETFs over the last three-month, one-year and five-year periods.
The entire universe of exchange-traded funds is accessible to AAII members at www.aaii.com/etf-guide. There you will find information on the nearly 2,400 ETFs currently in existence, including returns, risk, portfolio holdings and costs. Plus, this information is now updated monthly, as opposed to annually as it was in previous ETF guides. The inside front cover of this issue has more details on the online ETF Guide.
You’ll also be able to see the current grades for each ETF, where applicable. These grades cover returns, category risk ratios and expense ratios. They range from A to F. The scale works just like it did when you were in school, A’s are good, while F’s are bad. Each grade is tied to a percentile rank based on how a fund compares to its category peers. An ETF whose returns for a given period rank in the top quintile (best 20%) relative to its category peers will receive a grade of A. Lower grades are assigned for lower quintile rankings. So, a grade of C means the ETF’s returns for a certain period were about average relative to its category peers (the 41st to 60th percentile).
On AAII.com, you will find even more. In addition to monthly updates of the best- and worst-performing funds, you can view lists of the ETFs that have exceeded or fallen short of their category peers over the last three-, five- and 10-year periods. You can also track the exchange-traded funds you own and the ones you are interested in with our new My Portfolio tool.
Expanded Fund Data interactive lists of funds by category with detailed data on each fund.
The price war among ETFs we discussed in last year’s guide has been extended to the fixed-income side. BNY Mellon Core Bond ETF  (BKAG) became the first fixed-income ETF to have a 0% expense ratio. It was launched in April.
In total, there are 12 ETFs and exchange-traded notes (ETNs) designated as having 0% expense ratios in AAII’s database. The average assets under management (AUM) of these funds was just $26.0 million. This low number is skewed upward by the inclusion of SoFi Select 500 ETF (SFY), which has a still small $92 million in AUM. Put another way, the marketing pitch of 0% expense ratios has not attracted much in terms of investor dollars.
This isn’t to say that investors are not interested in very low expense ratios. Quite the contrary. As of the end of June 2020, slightly more than 28% of all ETF assets were controlled by funds charging $0.50 or less for every $1,000 invested (an expense ratio of 0.05% or less). More than half of all AUM was invested in ETFs charging expense ratios of 0.10% or less. To put these numbers into perspective, the median expense ratio for all ETFs is 0.49%.
On the brokerage side, in last year’s guide we noted how all of the major discount brokerage firms had expanded the number of ETFs offered on a commission-free basis. Within a few months of publication, these brokers ended commissions all together on stock and ETF trades placed online or through their smartphone and tablet apps.
In addition, Fidelity (through its mobile app) and Interactive Brokers (through its website, app and other platforms) are now allowing the fractional share purchase of exchange-traded funds. This can be helpful for ETFs like SPDR S&P 500 Trust (SPY), which had a per-share price above of $300 as of mid-July 2020. Brokerage apps like
Robinhood and Acorns also allow the purchase of fractional shares in ETFs.
Out of the nearly 2,400 ETFs, just 399 are active. Combined they account for just 2.7% of all ETF assets under management. PIMCO Enhanced Short Maturity Active ETF (MINT) and JPMorgan Ultra-Short Income ETF (JPST) account for 22% of the $120 billion allocated to active ETF assets.
Guinness Atkinson Funds filed regulatory paperwork with the U.S. Securities and Exchange Commission (SEC) to convert two of its actively managed mutual funds—the Guinness Atkinson Dividend Builder (GAINX) and the Guinness Atkinson Asia-Pacific Dividend Builder (GAADX)—to exchange-traded funds. If approved, they would be the first mutual funds to convert to an ETF format. Other fund families have launched ETF versions of their mutual funds, but none have done an actual conversion. (Vanguard offers ETF share classes for many of its passive mutual funds.)
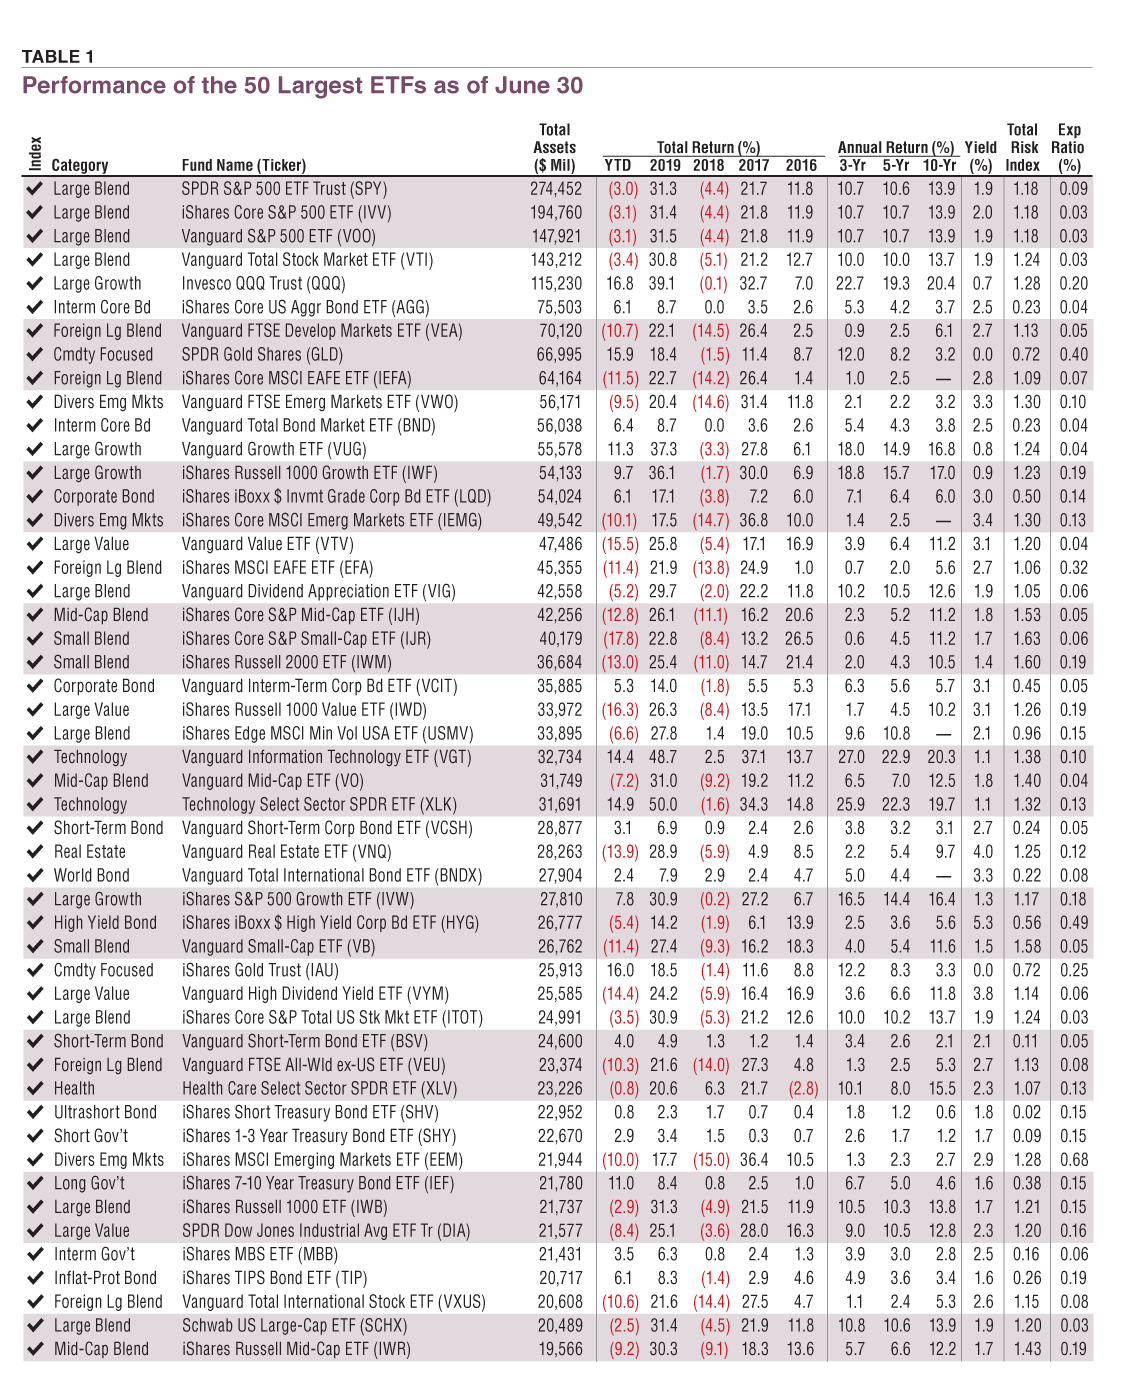
Table 1 shows the largest ETFs by assets as of June 30. As you can see by just glancing at the list, iShares and Vanguard ETFs account for the majority of the funds listed. This is not surprising given their respective market shares of the ETF industry.
The full list of exchange-traded funds can be accessed here.
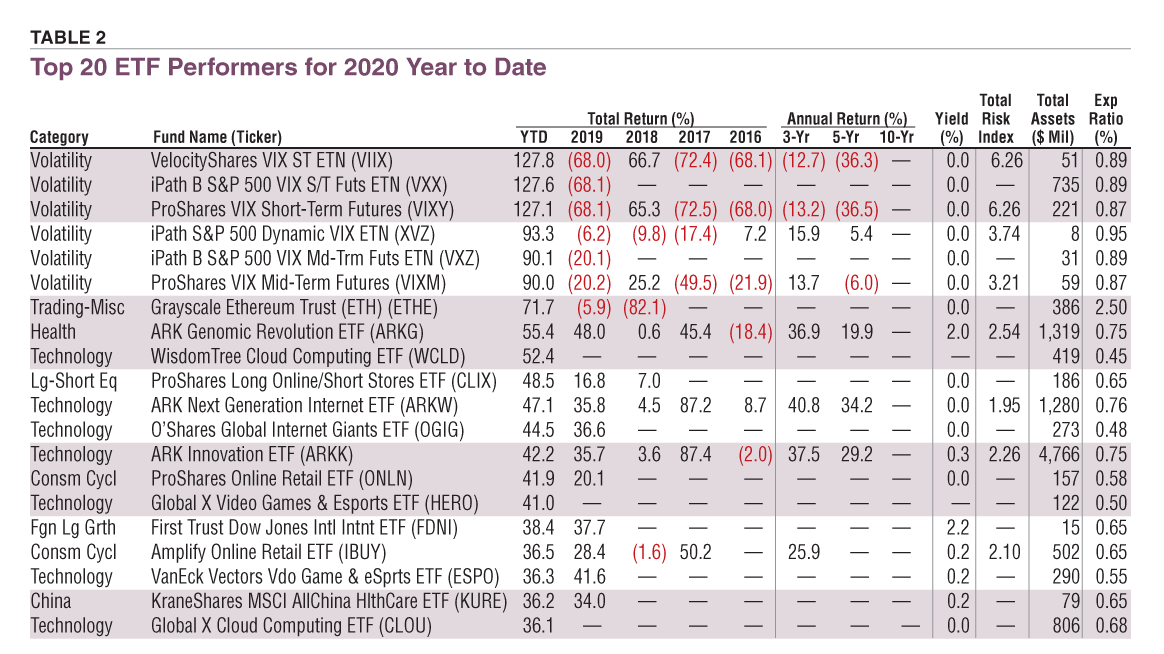
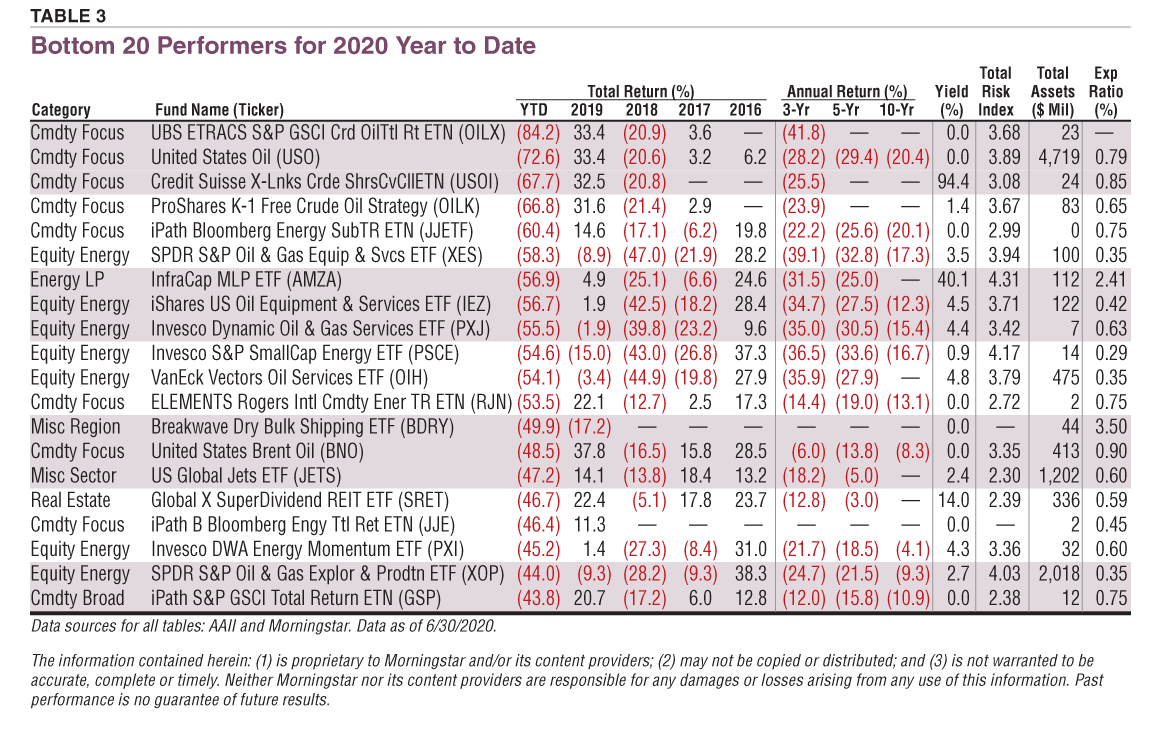
Tables 2 and 3 show the best- and worst-performing ETFs for the first half of 2020. The dataset is broader than the filtered universe used for the Quarterly ETF Update. In both cases, leveraged and inverse ETFs were excluded.
Tables 2 and 3 are updated monthly at the ETF Guide.
ETFs follow a variety of strategies. The largest ones track traditional stock and bond indexes, such as the S&P 500 index. The smallest ones can follow esoteric or very specific strategies, such as the First Trust Dow Jones International Internet ETF (FDNI). As its name implies, the fund invests in foreign companies generating a majority of their revenues from internet-based activities.
While it can be tempting to seek an advantage by buying a fund targeting a very specific industry, academic research has shown that the biggest impact on portfolio returns comes from the allocation decisions made (i.e., the percentage of total portfolio dollars allocated to stocks, the percentage allocated to bonds, etc.). Adhering to a well-thought-out allocation strategy over the long term will have a more beneficial impact than trying to make tactical decisions based on what you think will happen in the future.
A starting point for those looking to build a portfolio of ETFs is AAII’s Asset Allocation Models (www.aaii.com/asset-allocation). This webpage provides sample allocations for three types of investors: aggressive, moderate and conservative. (Note: we are in the process of tweaking the moderate and conservative models as part of The AAII Way investing plan project. See www.aaii.com/AAIIWay for more information.)
Long-term investors should seek out ETFs they can hold for years without having to worry much about the fund’s sustainability, performance or tax impacts. Allocation decisions matter greatly if the intent is to limit the number of transactions.
When building a portfolio of ETFs (or mutual funds), it is helpful to use a top-down approach. Determine which asset classes you want exposure to and then find the best funds targeting those asset classes. In contrast, a bottom-up approach seeks to build a portfolio from the best identifiable ETFs.
There are several parameters to consider when evaluating an ETF for a long-term position. Performance is an obvious one. The fund’s five-year return should be above or similar to its category average or its direct peers. Peer comparisons would be warranted for ETFs following a narrow version of a broad strategy such as value or dividend growth. Year-by-year returns also warrant being examined for unusual swings. An ETF with a high five-year return but large variances in annual returns relative to its category average annual returns may be less desirable than one with a slightly lower five-year return but more stable year-by-year returns relative to its category average annual returns.
One useful measure is the risk index. The risk index indicates how volatile a fund is relative to its category and all ETFs. A risk index of 1.00 denotes average risk. Values above 1.00 indicate greater risk than average, while values below 1.00 indicate less risk than average. A higher risk index reveals greater volatility in a fund’s recent (three-year) returns. It can suggest that the fund is more affected by certain market conditions and/or that you can expect greater fluctuations in the year-to-year returns. A fund with good long-term performance but a high risk index may not be suitable for a long-term investor who is unable to tolerate its higher level of volatility.
Assets under management matter because they give insights into whether a fund is likely to stay around or is at risk of being closed or merged into another fund at some point in the future. There is no single dollar amount at which a fund will be shut down, but ETFs with AUM under $100 million and particularly below $50 million should be viewed with caution. Large and medium-sized funds have AUM of $500 million or more. The largest ETFs have AUM in excess of $100 billion. [There is a significant gap in terms of AUM at the very top. The largest ETF, SPDR S&P 500 ETF, has $274 billion in assets versus $56 billion for the 10th largest ETF, Vanguard FTSE Emerging Markets ETF (VWO).]
If the ETF will be held in a taxable account, consider the tax-cost ratio. The tax-cost ratio measures how much an ETF’s annualized return is reduced by the taxes paid on distributions, assuming the maximum marginal tax rate. The lower the ratio, the more tax-efficient the ETF is. While most ETFs are tax-efficient, not all are. For instance, the Global X Nasdaq 100 Covered Call ETF (QYLD) has a three-year tax-cost ratio of 4.2%. Investors who held the fund in a taxable account saw their annualized returns reduced by 4.2 percentage points because of taxes. The tax-cost ratio is not applicable if the ETF is held in a tax-preferred account such as a traditional IRA or a Roth IRA, but it does signal potentially higher levels of turnover.
Speaking of costs, the expense ratio matters regardless of the type of account the fund is held in. The expense ratio is the sum of administrative fees and adviser management fees divided by the average net asset value of the ETF. It is charged each and every year you own the fund. ETF shareholders do not get billed for the expense ratio, rather it is taken out of a fund’s assets, diminishing the return that shareholders ultimately realize.
Expense ratios are shown in a percentage format. A 0.10% fee will cost you $1 for every $1,000 invested in a fund. A 0.50% fee will cost you $5 for every $1,000 invested. The more invested and/or the higher the expense ratio, the more you will pay every year. For example, a $5,000 investment in an ETF with a 0.50% expense ratio will incur an annual cost of $25 per year. This cost is in addition to any brokerage commissions and trading costs.
Buying an ETF is the same as buying a stock. The process is the same and, as mentioned, discount brokers no longer charge commissions on stock or ETF trades placed via their websites or apps. An investor simply needs to know the ticker symbol and the number of shares to be purchased. Limit orders, which specify the maximum price to be paid for a buy order or the minimum price accepted for a sell order, are suggested to protect against sudden, unexpected changes in the share price.
When placing an order to buy an ETF, it is important to look at the current bid/ask spread. The bid is the price that buyers are willing to pay. The ask is the price that sellers are demanding. Frequently traded ETFs tracking well-known indexes such as the S&P 500 usually trade at bid/ask spreads of $0.01 to $0.02 per share. Other ETFs may trade at wider bid/ask spreads. The larger the spread between the bid and the ask, the more expensive it will be to transact in the ETF and the lower your potential returns may be. ▪
Exchange-Traded Funds

Exchange-Traded Funds

Mutual Funds

J M from NJ posted over 6 years ago:
J G from KY posted over 5 years ago:
You need to log in as a registered AAII user before commenting.
Log InCreate an account