

Related

PRISM Wealth-Building Process
Modifying the allocation did not alter the primary benefits of rebalancing: significantly lower volatility as well as smaller drawdowns relative to not rebalancing.

Charles Rotblut leads a class in AAII's new Essential Investing Video Course. Go to https://www.aaii.com/ves for more information and to subscribe.
Since 2011, I’ve been conducting a rebalancing analysis using hypothetical portfolios. This year, the rebalancing models are being updated to reflect the recently revised AAII moderate portfolio allocation model. The revision reflects a more conservative approach, with a modified version of the traditional 60% large-cap stocks/40% bonds portfolio.
Also in this year’s update, I discuss the coronavirus bear market of 2020 and additional research from Vanguard. Vanguard revisited the issue of best practices for rebalancing.
Before going into the details, here are a few takeaways:
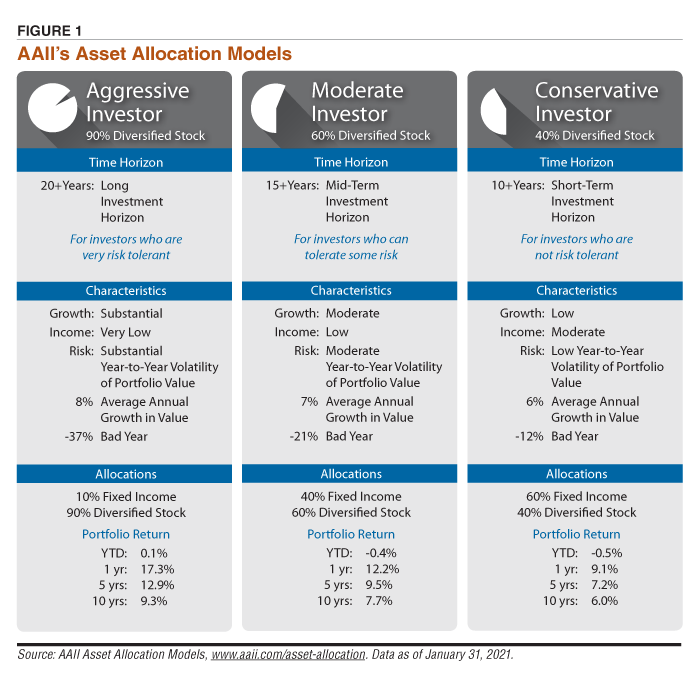
AAII’s moderate and conservative Asset Allocation Models were officially revised in 2020. The moderate allocation model—which this analysis uses—went from a 70% equity/30% fixed-income allocation to a 60% equity/40% fixed-income allocation. For the equity portion, the breakdown now used is 20% large-cap stock, 15% mid-cap stock, 10% small-cap stock and 15% international stock.
The 60/40 allocation is a well-established benchmark. It has held up well against a variety of more complex allocation strategies. It may also be easier for many investors to follow. This is important because one of the reasons investors bail on their investment strategy is because the level of volatility is too high. While volatility is the price of higher portfolio returns, not every investor has the psychological and/or financial tolerance for higher levels of volatility.
Figure 1 provides an illustration of the investor characteristics for the moderate allocation model, as well as the characteristics for two other AAII asset allocation models—aggressive and conservative.
Given the change in the model, returns going back to 1988 were recalculated for portfolios used in this analysis. All of the data shown here reflects the revised moderate allocation model, unless otherwise noted as such.
The returns are calculated from hypothetical portfolios. These portfolios use Vanguard funds to replicate the returns an investor could have realized after fund fees are factored in. The Investor shares class of funds was used for the period of 1988 through 2017. The Admiral shares class of funds was substituted in 2018 because Vanguard stopped offering the Investor shares class to most investors. Part of the goal of this study is to show the returns an investor could have realized in a real-world portfolio, gross of taxes and specific account fees (such as those charged by a workplace retirement plan). Though the allocation was revised, the funds used were not. Only the amount of the portfolio that was allocated to each fund differs from past years.
A start date of 1988 was used because it was the first full year that return data was available for some of the funds used in the models. The models are updated annually using year-end return data. Spreadsheets with the full data and a thorough explanation of the calculations are linked in the online version of this article.
The hypothetical portfolios are either non-withdrawal or withdrawal. No withdrawals are taken out of the first one (the non-withdrawal portfolio). The second, the withdrawal portfolio, assumes that a retiree makes annual withdrawals based on an inflation-adjusted 4.5% rate. (The withdrawal rate is discussed in more detail later in this article.)
To compare the effects of rebalancing, a non-rebalanced version is tracked alongside each hypothetical portfolio. The allocation for the non-rebalanced portfolios was established at the beginning of the study. No additional changes are made to the portfolios. Rather, their allocations evolve based on the weighted performance of each fund held. The rebalanced portfolios are periodically adjusted back to their targeted allocations whenever the weighting of any single fund is more than five percentage points above or below its target. The 5% band is based on a Vanguard study (“Best Practices for Portfolio Rebalancing,” May 2011 AAII Journal).
One question received over the years has been about using a different allocation. The answer is that the returns will change, but not the lessons about using rebalancing. Rebalancing preserves the portfolio’s allocation by requiring periodic adjustments.
If you believe following a specific allocation strategy is important, then you should have rules to rebalance at certain intervals to prevent your portfolio from straying too far away from your target.
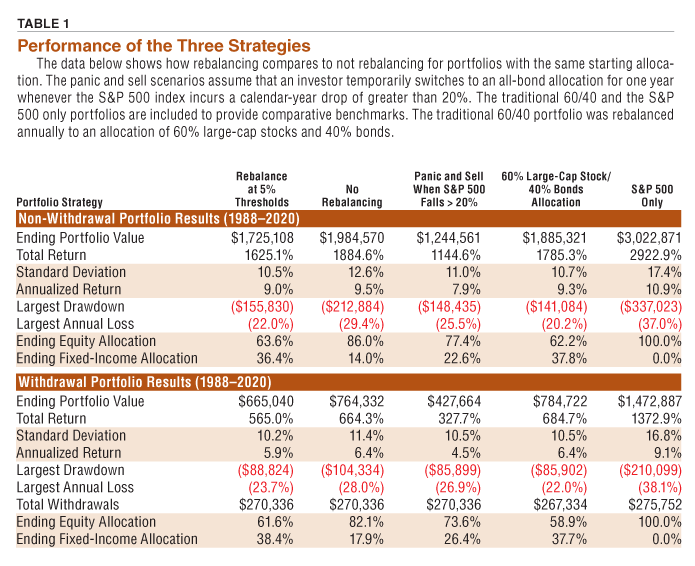
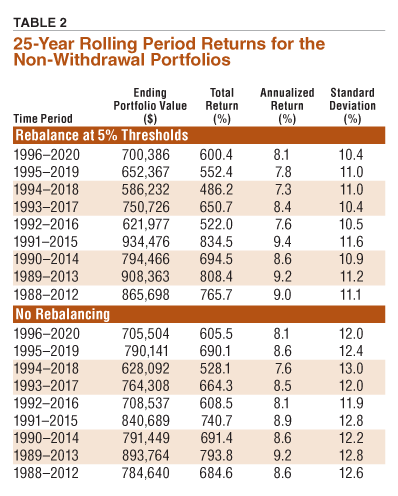
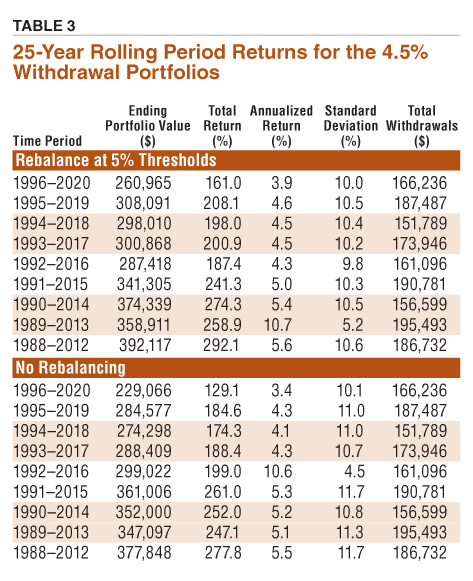
Two types of portfolios are presented in Table 1 (cumulative returns) and in Tables 2 and 3 (rolling 25-year periods) to account for different life-cycle stages readers may be in. Non-withdrawal portfolios have no outflows. The hypothetical portfolios are treated as being fully funded at their inception dates with the dollars invested allowed to grow over time.
Withdrawal portfolios are akin to those held by a person in retirement who is taking withdrawals to fund living expenses. A 4.5% inflation-adjusted withdrawal rate is used. This is the withdrawal rate suggested by retired financial planner William Bengen. Bengen created the widely followed 4% withdrawal rule. He later determined that a higher withdrawal rate of 4.5% of portfolio value could be used with a diversified portfolio.The models use the year-over-year change in the consumer price index for all urban consumers (CPIAUCSL) to determine the inflation adjustment to make to annual withdrawal amounts. It is a benchmark and can be substituted by a different measure.
Be aware that the withdrawal rate is a separate decision from whether rebalancing should be used. The allocation selected, the decision to rebalance or not and the withdrawal strategy used are all interrelated in terms of whether a retiree risks outliving their savings. For the purposes of this analysis, the same withdrawal rate is used across all withdrawal portfolios.
The trade-off for reducing risk is lower absolute returns. We see this in the performance of the hypothetical portfolios. Under the revised 60/40 allocation, the rebalanced non-withdrawal portfolio realized a 9.0% annualized return between 1988 and 2020. In comparison, the same portfolio using the original 70/30 moderate allocation model realized a 9.3% annualized return.
Returns are just one aspect. Volatility is another. A strategy is only as good as an investor’s ability to stick to it. The best-performing strategy won’t work if it is too volatile for an investor to continuously follow. On this basis, the rebalanced non-withdrawal portfolio using the revised 60/40 allocation was better, with a standard deviation of returns of 10.5% versus 12.0% for the portfolio using the older 70/30 allocation.
Another way to consider risk is drawdown. In 2008, the rebalanced non-withdrawal portfolio following the revised 60/40 allocation lost $155,830. This compares to a loss of $204,880 for the same portfolio under the older 70/30 allocation model.
These numbers show an improvement in the risk-adjusted returns for the revised moderate allocation. The improvement is also evident when withdrawals are taken. In both cases, there is slightly less return, but much less risk.
Modifying the allocation did not alter the primary benefits of rebalancing: significantly lower volatility as well as smaller drawdowns relative to not rebalancing. With the revised moderate 60/40 allocation, the 10.5% standard deviation of returns (volatility) for the rebalanced non-withdrawal portfolio compares to 12.6% for the non-rebalanced non-withdrawal portfolio. The maximum drawdown (2008) was approximately $57,000 less for the rebalanced non-withdrawal portfolio than the maximum drawdown for the non-rebalanced non-withdrawal portfolio.
Some of you may point to the drawdowns as a sign of rebalancing not working. This is not the case. Rebalancing worked. Its purpose is to help an investor adhere to a long-term strategy. Rebalancing is not designed to avoid losses on an annual basis. Could rebalancing be combined with a tactical approach? Yes, but it adds a layer of complexity that is beyond the scope of this article.
Revising the allocation made no difference in the number of times the portfolios were rebalanced. Rebalancing was required on 10 different occasions, or an average of once every 3.3 years.
In many cases, prompts to rebalance occurred on the same calendar years under both the 70/30 and the 60/40 allocations. Bear market years, such as 2002 and 2008 were, not surprisingly, periods when rebalancing was required. When there was a difference in timing, it wasn’t significant. For example, the rebalanced withdrawal portfolio was most recently rebalanced in 2019 under the revised 60/40 allocation model, whereas it would have been rebalanced at the end of 2020 had the older 70/30 allocation been used.
The allocation to bonds was most often outside of its targeted range when rebalancing was required. Consider the rebalanced withdrawal portfolio. The bond fund had a portfolio weighting of either below 35% or above 45% most times on a calendar-year basis (1998 was an exception for both the non-withdrawal and withdrawal portfolios).
AAII members who are retired may wonder about the impact on withdrawals from altering the allocation. The answer depends on several factors.
The cumulative amount taken under the Bengen strategy using adjusted withdrawals changed slightly because of how the base amount was determined. Our models treat the first withdrawal amount as being calculated based on year-end values. This means any difference in the portfolio’s first-year returns impacts withdrawals for all remaining years. The net impact after 33 years was approximately $2,800 less in cumulative withdrawals.
Not rebalancing caused the international allocation to be completely drained under the Bengen withdrawal scenario. In a scenario where the withdrawal amount was taken out evenly from all funds, the international fund was completely drained at the end of 2008 under the revised 60/40 moderate allocation versus at the end of 2019 under the older 70/30 moderate allocation. An allocation to the international fund was maintained when rebalancing was used, however.
If required minimum distributions (RMDs) were used instead, there would be a difference in annual and cumulative withdrawals as well. This is because RMDs are calculated based on a combination of the balance of account(s) subject to the mandatory withdrawals, the age of the account holder and the life expectancy table used. Anything that changes the year-end balances changes the RMD amounts as well.
We ran the numbers using the Internal Revenue Service’s (IRS) Uniform Lifetime Table III to see what the impact of RMDs would be. This table applies to singles and married owners whose spouses aren’t more than 10 years younger. Rebalancing preserved the allocations, while not rebalancing completely drained both the international and small-cap allocations.
There are caveats. We ran the withdrawals over a 33-year period. The international fund was drained at age 83 (assuming a starting age of 70) and the small-cap fund was drained at age 92 when no rebalancing was done. Depending on the account owner’s life-span and age when withdrawals started, the outcomes may be different. A different life expectancy table would also alter the outcome. Not to mention that in a real-world portfolio, some adjustments to the portfolio allocations might have been made.
As noted previously, the portfolios are checked annually to see if rebalancing is needed. This meant no action would have been taken in response to last year’s bear market because of when it occurred. The drop and the subsequent recovery occurred within the confines of a calendar year.
This is where the difference between using a fully systematic approach and allowing for some flexibility in how the approach is applied comes into play. An investor who was willing to be a bit tactical in the application of a rebalancing approach may well have found an opportunity to rebalance last March.
On the other hand, knowing that a system was in place to preserve the portfolio’s allocation and reduce volatility might have given another investor the confidence not to react. They might instead have found comfort in knowing they had a long-term strategy in place that only required checking the portfolio at preset time intervals.
The choice to check the portfolio annually and rebalance if any of the allocations were above or below their targets by five percentage points or more for this analysis was based on the previously mentioned 2011 Vanguard study. In a 2019 study, Vanguard looked at a variety of monitoring periods and rebalancing thresholds (“Getting back on track: A guide to smart rebalancing”).
Specifically, they considered checking on a monthly, quarterly and annual basis to see if rebalancing was required. They also used rebalancing thresholds of 0%, 1%, 5% and 10% for a portfolio allocation target of 60% stocks and 40% bonds.
In all cases, annualized volatility was reduced from 14.0% to a range of between 11.4% to 11.8%. Tax-adjusted annualized returns for the rebalancing strategies ranged between 8.19% and 8.39% versus 8.74% for the non-rebalanced strategy. Neither is surprising considering the average allocation to stocks for the non-rebalanced strategy was 85% versus 60% to 63% for the rebalancing strategies. However, the Sharpe ratio—a measure of risk-adjusted returns—was higher for all of the rebalanced strategies. (A higher Sharpe ratio is preferable.)
The authors of the study wrote: “Ultimately, we believe that investors will benefit from systematic rebalancing, but we don’t find a specific rebalancing threshold or frequency that consistently outperforms other forms of rebalancing. It may behoove investors not to stress about the specifics but rather to choose a rebalancing strategy they can comfortably stick with.”
When done in a taxable account, rebalancing will result in capital gains being realized. Opting for a large threshold before rebalancing is required and extending the frequency at which the portfolio is checked will spread out the timing of when action is needed.
Our analysis has shown that rebalancing was required an average of once every 3.3 years between 1988 and 2020. The time period between rebalancing events varies. During periods of high volatility, such as 2002 to 2003 and 2008 to 2009, the non-withdrawal rebalanced portfolio was rebalanced on consecutive years. During the six-year period of 1988 through 1993, no rebalancing was required for the non-withdrawal rebalanced portfolio.
Looking at the longer period of 1926 through 2018, Vanguard found that a traditional 60/40 portfolio would have needed to be rebalanced 34 times if a 5% threshold and annual monitoring were used. The number of occurrences decreased to 14 if a 10% threshold was used. When monitored on a quarterly basis, the frequency of rebalancing rose to 47 and 19 times at 5% and 10% thresholds, respectively.
Those concerned about rebalancing can seek to do as much of it as possible in tax-preferred accounts. These include IRAs, Roth IRAs and 401(k) plan accounts. If rebalancing is done in a taxable account, any losses realized during the same tax year can be used to offset the gains realized from rebalancing. Similarly, income from dividends or distributions can be used to assist with the rebalancing. Those who are still contributing to their savings can strategically determine where new dollars are targeted to assist with rebalancing.
Vanguard suggests two other options. Once is to do partial rebalancing with a focus on selling those assets with the highest cost basis (and therefore the lowest tax impact). The second is to either gift appreciated shares to a charity or, if retired, use qualified charitable distributions (QCDs) to reduce overall taxable income.
While taxes are a consideration for many investors, it is important not to let the tax tail wag the portfolio dog. Focus on your investment strategy first and taxes second.
Downloads:
We think you’d like this related webinar! The Individual Investor Show: First Cuts of Dividend Aristocrats + International Funds, Rebalancing
PRISM Wealth-Building Process

AAII InvestoGraphic

Portfolio Strategies

Portfolio Strategies

J M from NJ posted over 5 years ago:
J M from NJ posted over 5 years ago:
CHARLES R from IL posted over 5 years ago:
J M from NJ posted over 5 years ago:
CHARLES R from IL posted over 5 years ago:
J M from NJ posted over 5 years ago:
CHARLES R from IL posted over 5 years ago:
Leo W from NJ posted over 5 years ago:
Robert G from MI posted over 5 years ago:
CHARLES R from IL posted over 5 years ago:
ROBERT A from NC posted over 5 years ago:
JAMES F from FL posted over 5 years ago:
John M from MI posted over 5 years ago:
You need to log in as a registered AAII user before commenting.
Log InCreate an account