



- T. Rowe Price is among the oldest mutual fund companies still independently operating
- Investors who prefer T. Rowe Price funds can find options that align with AAII Asset Allocation Models
- Eligible funds have low expense ratios and above-average performance
The AAII Asset Allocation Models can be followed using T. Rowe Price no-load mutual funds and exchange-traded funds (ETFs). We focus here on suitable options that have low expense ratios and returns above their category average.
The AAII Asset Allocation Models provide sample allocations based on an investor’s time horizon and ability to withstand short-term market volatility. The models incorporate stocks, bonds and cash to build a successful allocation strategy.
In past articles on AAII Asset Allocation Models, we offered suggestions for employing index funds, including focusing on particular styles like growth and value, and options for utilizing equal-weighted funds. Throughout, we examined mutual funds and ETFs across different fund families.
The base models are tracked using Vanguard funds, but other fund families work as well. Individual investors often face restrictions in their investment selections. Additionally, many investors simply have a preference for a specific fund family. To address this, we are examining the offerings of specific fund providers to discuss which of their mutual funds and ETFs could be used for implementing the AAII Asset Allocation Models within your portfolio.
We covered Fidelity funds in the September 2023 AAII Journal and BlackRock funds in the May 2024 issue. We are now expanding our analysis to T. Rowe Price. Founded in 1937, T. Rowe Price is among the oldest mutual fund companies still independently operating. Its management committee has an average tenure of 17 years. The combined assets of T. Rowe Price mutual funds and ETFs that are included in our database exceed $3.4 trillion as of June 30, 2024. The firm is known for its active management capabilities and its depth of research resources.
How We Selected Specific T. Rowe Price Mutual Funds and ETFs
We required mutual funds to be identified by Morningstar as true no-load funds and open to new investors. Institutional, adviser, retirement and S class shares were excluded, and a minimum purchase amount was set to be no higher than $50,000. The universe of 452 T. Rowe Price mutual funds was narrowed to 18. Share classes of S are similar to no-load funds in that there is usually no front-end or deferred (back-end) load charged but the minimum required investment may be higher.
The year-to-date and three-year and five-year annualized returns were required to rank in the 40% to 100% range for the fund’s category (A+ Investor Grade of A, B or C). Returns in the average range (40% to 60%) might seem below what we would advocate for inclusion in the AAII Asset Allocation Models, but relaxing this restriction allowed us to consider a larger group of mutual funds. Any funds that had below-average performance (grade of D or F) across these periods were not included. Additional criteria were applied to arrive at the 18 mutual funds shown in Table 1.

Download the Excel spreadsheet for Table 1.
The Investor share class identifies funds that are available for purchase by individual investors. We found several different access levels for no-load mutual funds that Morningstar classifies as “other” share class. In cases where these funds are available for purchase through a brokerage account at Fidelity and Charles Schwab, they are included in our listing.
T. Rowe Price Mutual Funds
Large Blend
The T. Rowe Price U.S. Large-Cap Core fund  (TRULX) is a large blend fund that seeks to provide long-term capital growth. It selects holdings by using fundamental bottom-up research, focusing on analysis and attributes of specific growth and value stocks. Actively managed, it benchmarks its performance to the S&P 500 index. Per the fund’s fact sheet as of June 30, 2024, it beat the S&P 500 over three-month, one-year and three-year periods but fell short over five-year and 10-year periods. The portfolio is concentrated, with 78 holdings and 38.9% of the portfolio invested in the top 10 holdings. With its large-cap holdings, it could be a substitute for the Vanguard 500 Index Admiral fund (VFIAX) used in the AAII Asset Allocation Models. Its year-to-date, three-year and five-year returns are above the category average. Its expense ratio of 0.64% is lower than the large-cap blend category average, for an AAII A+ Investor Grade of B.
The actively managed T. Rowe Price U.S. Equity Research fund (PRCOX) is the only fund in Table 1 with A+ Investor Grades of A across the board for all three performance time frames and for its low expense ratio of 0.44%.
As an index fund option, the T. Rowe Price Equity Index 500 fund (PREIX) could also be considered for the large blend allocation. As the name suggests, it tracks the S&P 500. It has above-average returns for all periods shown in Table 1. The expense ratio of 0.19% earns the fund an A+ Investor Grade of A. Though this is very low, there are even cheaper alternatives for tracking the S&P 500 from other fund families. They include the Fidelity 500 Index fund (FXAIX) and the Vanguard 500 Index Admiral, with expense ratios of 0.02% and 0.04%, respectively.
Large Growth
There are a handful of options available for those who wish to add growth exposure to their portfolio. The three T. Rowe Price large-cap growth funds in Table 1 have differing strategies.
The T. Rowe Price All-Cap Opportunities fund (PRWAX) invests primarily in common stocks of U.S. companies operating in sectors of the economy that T. Rowe Price believes are the fastest growing or have the greatest growth potential. A unique feature of the fund is that while it generally takes a growth approach to stock selection, it can invest in companies with either growth or value characteristics. The fund has a long track record, with an inception date of September 30, 1985. It beat its benchmark, the Russell 3000 index, over the past one-, three-, five-, 10- and 15-year periods. (The Russell 3000 is a market-capitalization-weighted equity index representing the entire U.S. stock market.) The year-to-date return for the fund is average, but over three- and five-year periods its returns are above average. The expense ratio of 0.79% is lower than the category average.
The T. Rowe Price Tax-Efficient Equity fund (PREFX) takes a different approach. It seeks to maximize aftertax growth of capital. The impact of this strategy is evident in a low tax-cost ratio of 0.4% based on its 10-year annualized return, which implies that investors in the highest tax brackets have lost comparatively little return to taxes. A combination of fundamental, bottom-up analysis and top-down quantitative strategies is used to identify and hold companies with long-term appreciation prospects. Be aware that the fund is heavily concentrated, with the top 10 holdings making up 53.9% of the portfolio. Information technology is the largest sector at 47.3%. Year-to-date performance is above average, with an A+ Investor Grade of B, while performance over the past three- and five-year periods received A+ Investor Grades of C. At 0.83%, its expense ratio is average.
The final large-cap growth option is the T. Rowe Price Large Cap Growth fund (TRGOX). The fund invests in growth companies that have a market cap larger than the median of the companies in the Russell 1000 Growth index. It has an above-average five-year return of 16.4%.
Large Value
Three large-cap value funds are also included in Table 1. The T. Rowe Price Value fund (TRVLX) strives to provide long-term capital appreciation by investing in stocks believed to be undervalued, with income as a secondary objective. While the fund focuses on large stocks, it may invest in stocks of any size. Financials represent its largest sector allocation at 22.6%. Performance over the year-to-date and three- and five-year periods has been mixed, with A+ Investor Grades of A, C and B, respectively. Its expense ratio is lower than average at 0.71%.
The other two large value funds in Table 1 provide exposure to large value through slightly different strategies: the T. Rowe Price Equity Income fund (PRFDX) focuses on dividend income and the T. Rowe Price Integrated U.S. Large-Cap Value Equity fund (TQMVX) uses a variety of fundamental metrics to identify undervalued large-cap stocks.
Mid-Cap Blend
The T. Rowe Price Integrated U.S. Small-Mid Cap Core Equity fund (TQSMX) is categorized as a mid-cap blend fund. It is actively managed and tracks the Russell 2500 Total Return index, which measures the performance of the small- to mid-cap segment of the U.S. equity universe. Year to date and over the three- and five-year periods, the fund has been a top-quintile performer, with all grades of A. Per the fact sheet on T. Rowe Price’s website, the fund has exceeded its benchmark for the three-month, year-to-date and one-, three- and five-year periods and since its inception on February 26, 2016. A quick look at the geographic exposure for this fund indicates that it mostly holds U.S. equities but also holds small allocations of equity from Canada, Panama and Israel, among other countries. Its expense ratio is average at 0.87%.
Small Growth
The T. Rowe Price Integrated U.S. Small-Cap Growth Equity fund (PRDSX) is the only small-cap fund to pass the screen. It is constructed with only 10.1% of the portfolio invested in the top 10 holdings. Fundamental analysis and quantitative models are combined to identify stocks that may be included in the portfolio. Stocks are then selected based on valuation, profitability, quality and other metrics with an eye toward near-term appreciation. Above-average returns and an attractive expense ratio characterize this fund.
Foreign Large Blend
The T. Rowe Price International Equity Index fund (PIEQX) garnered above-average returns over the three- and five-year periods, as indicated by the A+ Investor Grades of B. Its expense ratio of 0.26% is also lower than the category average. Financials, at 19.7%, and Japan, at 22.2%, are the largest sector and geographic allocations, respectively. Well-known firms like Toyota Motor Corp. (TM), Novo Nordisk A/S (NVO) and Shell PLC (SHEL) are included in the top 10 holdings.
Fixed Income
While the T. Rowe Price Short-Term Bond fund’s (PRWBX) A+ Investor return grades are C, its expense ratio of 0.46% is lower than average for the short-term bond category. This fund has 855 holdings. Its largest sector allocation is to corporate bonds and notes, followed by U.S. Treasury bonds and notes. As a percentage of assets, its largest exposure (71.2%) is to bonds that mature in one to five years.
T. Rowe Price ETFs
T. Rowe Price is a relatively new entrant to the ETF industry, with its first ETFs launched in August 2020. Just five T. Rowe Price ETFs matched our criteria, listed in Table 2. All five are actively managed ETFs and have an average daily trading volume of at least 5,000 shares. The limited data makes it harder to compare them against funds with longer histories.
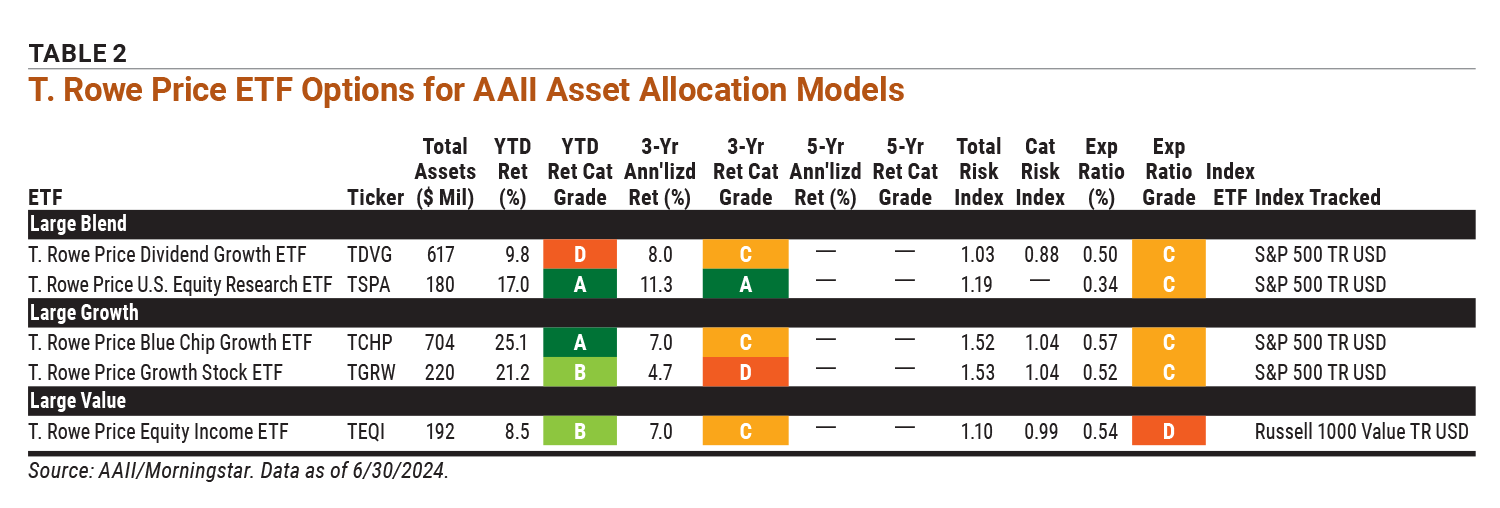
Download the Excel spreadsheet for Table 2.
Large Blend ETFs
The two qualifying ETFs in the large blend category are the T. Rowe Price Dividend Growth ETF (TDVG) and the T. Rowe Price U.S. Equity Research ETF (TSPA). Dividend payments and increases are typically a long-term indicator of financial health and stability.
T. Rowe Price Dividend Growth is among the inaugural ETFs launched by the fund family in August 2020. It invests in stocks with a strong track record of paying dividends or that are expected to pay dividends over time (even if not currently paying dividends). For its year-to-date return, it has an A+ Investor Grade of D, while its three-year track record results in a grade of C. The dividend focus may be partially why. The 0.50% expense ratio is average for this category.
T. Rowe Price U.S. Equity Research attempts to create a portfolio with similar characteristics to the S&P 500 with the potential to outperform the index. It has A+ Investor Grades of A for its year-to-date and three-year returns, while its expense ratio of 0.34% is average for the category.
Large Growth ETFs
The two options available in the large growth category were also launched in 2020. The T. Rowe Price Blue Chip Growth ETF (TCHP) has top-quintile year-to-date performance, but its three-year performance is average compared to its peers. The T. Rowe Price Growth Stock ETF (TGRW) has an above-average year-to-date A+ Investor Grade of B but a below-average three-year grade of D. Both have average expense ratios—0.57% and 0.52%, respectively.
Large Value ETF
The T. Rowe Price Equity Income ETF (TEQI) was also launched in August 2020. It has a similar strategy to the T. Rowe Price Dividend Growth in that it focuses on large-cap stocks with a strong track record of paying dividends. However, it is more value-oriented in its approach.
This ETF does not disclose its holdings daily, as most ETFs do. Instead, T. Rowe Price publishes what is called a proxy portfolio that includes some of the ETF’s holdings but not the entire portfolio. As a result, the T. Rowe Price Equity Income ETF may trade at greater premium or discount to net asset value (NAV) than a similar ETF that discloses its holdings and trade information. Of the five ETFs shown in Table 2, this is the only ETF lacking transparency.
Where to Find Data on T. Rowe Price Funds
AAII members have access to portfolio and performance data through the Fund and ETF Evaluators. Type the fund’s name or ticker in the search box at AAII.com and then choose the fund from the drop-down list.
For a deeper dive, T. Rowe Price’s website provides a fund’s sector allocation, top 10 holdings and geographic exposure, updated monthly.
Other articles in this series found on AAII.com:
- Meeting Your Asset Allocation Needs With BlackRock Funds and ETFs, May 2024
- Using Fidelity Funds to Fill Your Asset Allocation Needs, September 2023
- Incorporating Equal-Weighted Funds Into Your Allocation, June 2023
- Tilting AAII’s Asset Allocation Models to Match Your Growth or Value Style, March 2023
- Index Fund Options for AAII’s Asset Allocation Models, November 2022
Discussion
FREE REPORT

ROBERT A from NC posted over 2 years ago:
You need to log in as a registered AAII user before commenting.
Log InCreate an account