



Featured Tickers:
- BlackRock is one of the world’s largest asset managers and its ETFs are among the least costly
- Investors who prefer BlackRock funds can find options that align with AAII Asset Allocation Models
- Criteria required include below-average expense ratio and above-average performance
If you have a preference for BlackRock funds—including the iShares exchange-traded funds (ETFs)—we take a look at those that can be used to follow the AAII Asset Allocation Models. The BlackRock mutual funds and ETFs highlighted here not only have low expense ratios but also exhibit above-category returns.
The AAII Asset Allocation Models provide sample allocations based on an investor’s time horizon and ability to withstand short-term market volatility. The models incorporate three essential building blocks to a successful allocation strategy: stocks, bonds and cash.
In previous articles discussing the AAII Asset Allocation Models, we provided ideas for using index funds, such as tilting them toward specific styles like growth and value. We also showed options for using equal-weighted funds. In every case, we considered mutual funds and ETFs from a variety of fund families.
However, some individual investors are constrained in their investment choices. Many defined-contribution plans—like 401(k)s or 403(b)s—are tied to a specific fund family. Those using a 529 plan to save for education expenses may also be limited. Other investors may have accounts set up with a specific fund family or otherwise be incentivized to use funds from a specific fund company. Many investors simply prefer a specific fund family. To account for this, we are looking at the offerings from specific mutual fund and ETF providers to discover options that can be used to implement the AAII Asset Allocation Models in your portfolio.
Therefore, we shifted the focus to Fidelity (“Using Fidelity Funds to Fill Your Asset Allocation Needs”) in the September 2023 AAII Journal and are now expanding our analysis to BlackRock mutual funds and ETFs. Not only is BlackRock one of the world’s largest asset managers, but its ETFs are also among the least expensive to own. The combined assets of BlackRock mutual funds and ETFs that are included in our database exceed $4.7 trillion as of March 31, 2024. According to its Form 10-K filed with the U.S. Securities and Exchange Commission (SEC) for the fiscal year ending December 31, 2023, the firm had $10.0 trillion in assets under management.
Selecting Specific BlackRock Mutual Funds and ETFs
Our process for narrowing down the 547 BlackRock mutual funds and 430 iShares ETFs found in our mutual fund and ETF screeners as of March 31, 2024, was based on a few key criteria. All funds had to be from categories matching those used in the AAII Asset Allocation Models. No target-date funds, sector equity funds, allocation funds, etc., were included. All mutual funds had to be no-load and directly accessible to individual investors.
The A+ Investor Grade for expense ratio was required to be A or B. These grades are assigned to funds whose expense ratios are below average for their category. This was important since expense ratios are the one component investors can control. Higher expense ratios translate into needing higher returns just to be on equal footing with the returns of a fund with a lower expense ratio.
Returns were required to be above average relative to a fund’s category peers for most annualized periods when possible. Funds that rank in the top 20% of their category for a given period are assigned an A+ Investor return grade of A, and those that rank in the top 40% earn a grade of B.
BlackRock Mutual Funds
Requiring mutual funds to be identified by Morningstar as true no-load funds and open to new investors; excluding institutional, adviser, retirement and S class shares; and setting a minimum purchase amount no higher than $50,000 narrowed the universe to 14. Share classes of S are similar to no-load funds in that there is usually no front or deferred (back-end) load charged but the minimum investment may be higher.
This is a small field coming out of the gate. We further required the year-to-date, three-year and five-year returns to be in the 40% to 100% category rank range. Returns in this range might seem below what we would advocate for inclusion in the AAII Asset Allocation Models, but relaxing this restriction allowed us to consider a larger group of mutual funds. We removed any funds that had average performance (grade of C) across the year-to-date, three-year and five-year periods. There were a few additional restrictions applied to the selection of these mutual funds.
The Morningstar share classification for noninstitutional, non-retirement, non-adviser and non-S share class funds commonly covers funds that are available for purchase by individual investors. This includes shares that are classified as no-load and “other.”
We found several different access levels among the mutual funds classified by Morningstar as “other” share class funds. Two examples are the iShares MSCI EAFE International Index G fund  (BTMGX) in the foreign large blend category and the BlackRock Core Bond fund (CCBBX) in the intermediate core bond category. Both are limited to wealth advisory clients or investors who have an account with BlackRock such as through an employer-sponsored retirement plan. They are not available for purchase in a brokerage account; therefore, they are excluded from our listing.
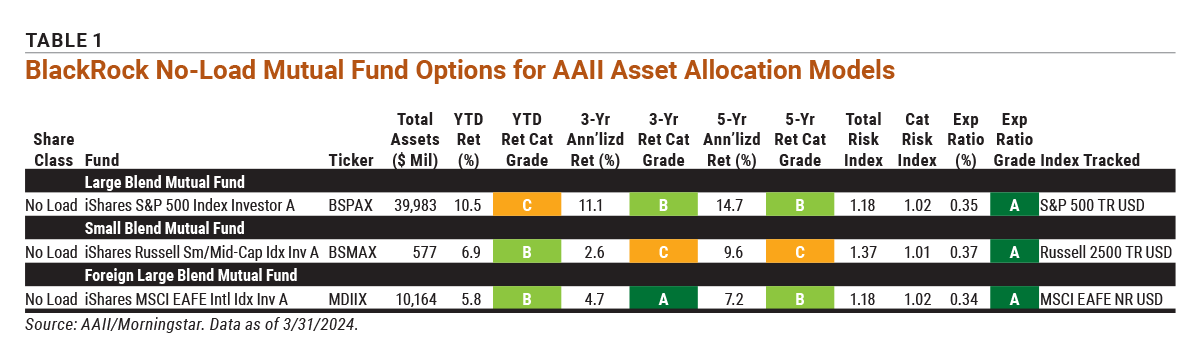
The handful of funds in Table 1 are those that passed our screens and are available for individual investors to purchase in their brokerage accounts.
Download the Excel spreadsheet for Table 1.
The iShares S&P 500 Index Investor A fund (BSPAX) is a market-capitalization-weighted fund that can serve as a large-cap holding and substitute for the Vanguard 500 Index Admiral fund (VFIAX) used in the AAII Asset Allocation Models. Tracking the S&P 500 Total Return index, this BlackRock mutual fund holds approximately 500 stocks. The index includes all U.S. companies with readily available prices. The iShares S&P 500 Index Investor A has achieved above-average returns compared to most of its peers on a three-year and five-year basis. It is competitive with its peers on a year-to-date basis. Its expense ratio of 0.35% ranks in the cheapest quintile of large-cap blend funds. A 12b-1 fee of 0.25% is included in this expense ratio.
The iShares Russell Small/Mid-Cap Index Investor A fund (BSMAX) is also a market-cap-weighted fund. It tracks the Russell 2500 Total Return index, which measures the performance of the small- to mid-cap segment of the U.S. equity universe. Year to date through March 31, the fund has achieved above-average performance. Over the three- and five-year periods, it has achieved returns that are about average for the small blend category. For context, the fund has returned 6.9% year to date while the S&P MidCap 400 index has returned 9.5% and the S&P SmallCap 600 index has returned 2.0%.
BlackRock provides each fund’s exposure along with the exposure of the underlying benchmark index on its website. You can locate this information by scrolling to “Exposure Breakdowns” once you are on a particular fund’s webpage. These pages show exposure by sector, geography and market cap. A quick look at the market-cap tab for the iShares Russell Small/Mid-Cap Index Investor A indicates that there was a 12.6% exposure to small-cap stocks and a 55.0% exposure to mid-cap stocks as of March 28, 2024. With an expense ratio of 0.37%, it ranks among the cheapest in the small blend category.
The final mutual fund that passed our screens is the iShares MSCI EAFE International Index Investor A fund (MDIIX). This is the share class version of the aforementioned iShares MSCI EAFE International Index G that is widely available. It has surpassed its peers with performance on a year-to-date, three-year and five-year basis. Its expense ratio of 0.34% is below average (inexpensive) for the foreign large blend category. As a true international fund, Japan represents its largest exposure with a 23.5% portfolio weighting. The fund closely tracks the MSCI EAFE (Net Total Return) benchmark index. By market cap, stocks held in the fund are 91.7% large-cap and 8.3% mid-cap. There are no small-cap holdings.
BlackRock (iShares) ETFs
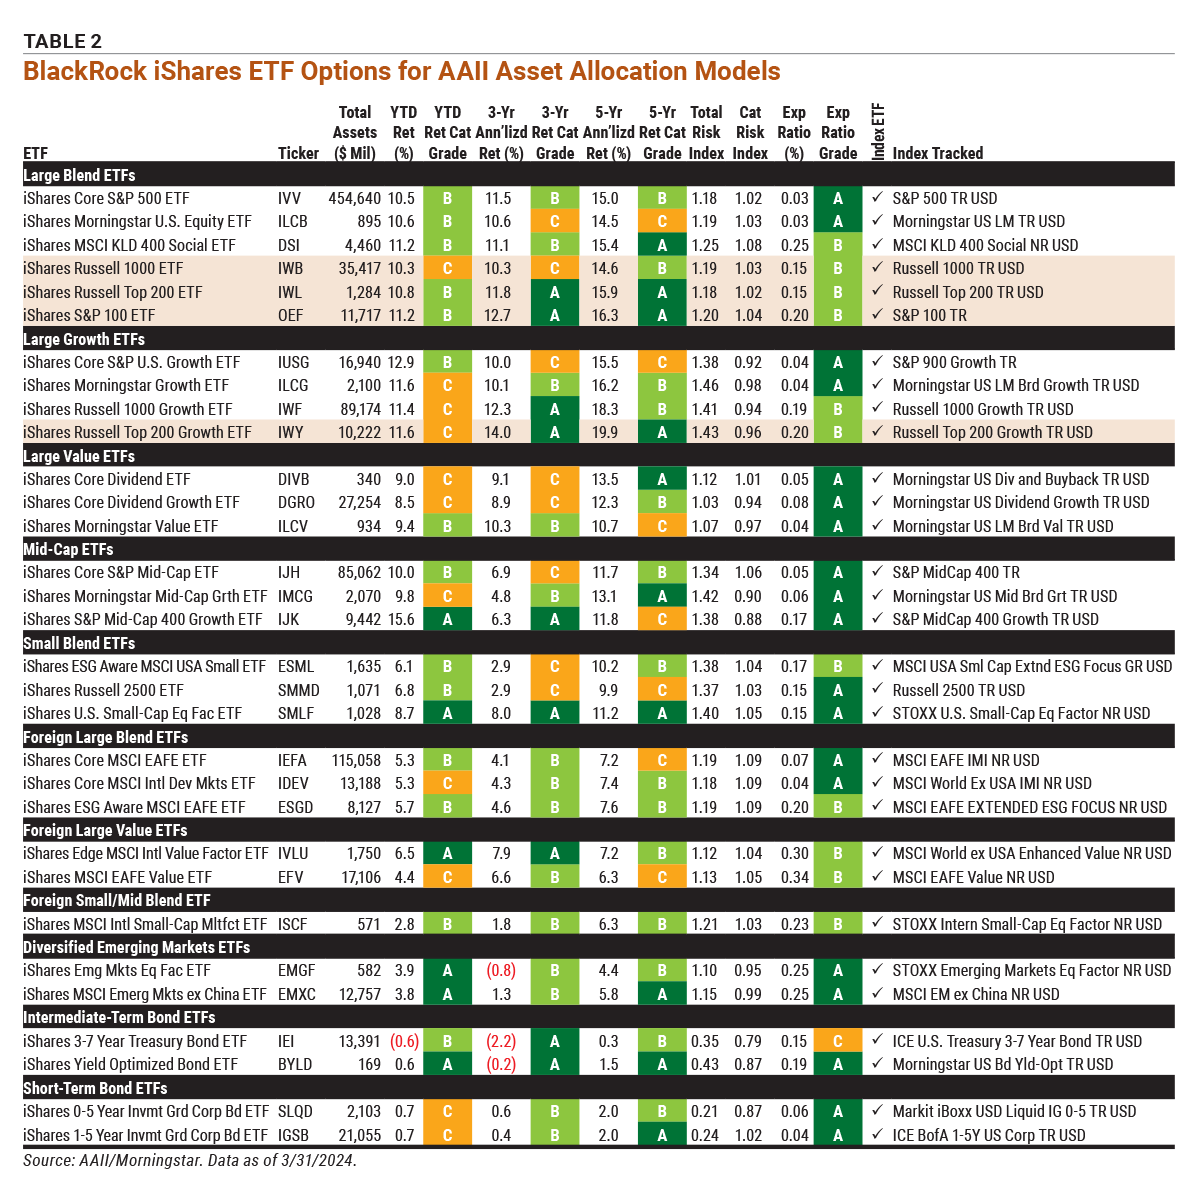
There were considerably more funds from BlackRock’s iShares ETF lineup that passed our screens. We applied the same performance and expense ratio criteria that was applied to the mutual funds, aside from the share class limits and the minimum purchase limit. (The latter two criteria only apply to mutual funds.) The list of ETFs is limited to those matching the AAII Asset Allocation Models categories. The 31 passing ETFs in Table 2 represent 11 categories. All are index ETFs and have an average daily trading volume of at least 5,000 shares.
Download the Excel spreadsheet for Table 2.
In the equity categories, we include both growth and value funds when available for investors who wish to tilt their portfolios toward either style.
iShares Large Blend ETFs
In a reflection of the company’s large number of ETF offerings, six of BlackRock’s iShares large blend ETFs qualified. The iShares Core S&P 500 ETF (IVV) is a broad-based ETF that tracks the S&P 500 Total Return. Its expense ratio is ultracheap at 0.03%. Additionally, the fund boasts above-category-average performance across all three return periods presented. The iShares Russell 1000 ETF (IWB) tracks the Russell 1000 Total Return index. These two ETFs are the largest in terms of total assets of the six iShares funds shown in this category.
Their top holdings are the same, though with slightly different weightings. The iShares Russell 1000 has average year-to-date and three-year performance. Its expense ratio is higher than the iShares Core S&P 500, though still very low on an absolute basis at 0.15%. Its five-year performance is above average for the large blend category.
iShares Large Growth ETFs
Four choices are available in the large-cap growth category based on our criteria. Due to their broad-based nature, core options are always appealing to individual investors. The iShares Core S&P U.S. Growth ETF (IUSG) has an exceptionally low expense ratio (0.04%) and above-average performance year to date. However, the iShares Russell 1000 Growth ETF (IWF) did better on a three- and five-year basis with the trade-off of a higher expense ratio (0.19%). The iShares Russell Top 200 Growth ETF (IWY) has the best performance in this category for the three- and five-year periods. It holds 114 stocks, compared to 444 for the iShares Russell 1000 Growth and 478 for the iShares Core S&P U.S. Growth. While all are inherently diversified, differences in the composition of the underlying indexes account for the variances in portfolio sizes and performance. The iShares Russell Top 200 Growth, which tracks the largest growth stocks in the U.S., also has the highest expense ratio (0.20%) of the large growth ETFs presented.
Large Value ETFs
ETFs within a given category can have a variation of strategies and objectives. Dividend strategies are included in the large-cap value category per Morningstar’s data categorization methodology. We mention this because two of the three large-cap value-oriented iShares ETFs that passed our screens are dividend-focused ETFs.
Investors looking for more of a pure value play might consider the iShares Morningstar Value ETF (ILCV), which offers exposure to U.S. companies thought to be undervalued by the market relative to comparable companies. The other two have strategies anchored around dividends. The iShares Core Dividend ETF (DIVB) invests in U.S. companies that return capital to shareholders through dividend payments and/or stock repurchases, whereas the iShares Core Dividend Growth ETF (DGRO) specifically seeks rising dividends. Their yields are 2.8% and 2.3%, respectively, as of March 31, 2024.
Mid-Cap and Small Blend ETFs
Within the mid-cap category, there is one core ETF and two growth ETFs. The iShares Core S&P Mid-Cap ETF (IJH) represents the traditional broad-based core exposure by tracking the S&P MidCap 400. The other two ETFs are growth-oriented. The iShares Core S&P Mid-Cap 400 Growth ETF (IJK) holds fewer stocks than the iShares Morningstar Mid-Cap Growth ETF (IMCG)—250 versus 309—and follows a better-known index. It also has better year-to-date and three-year returns, whereas the iShares Morningstar Mid-Cap Growth has a lower expense ratio.
The iShares U.S. Small-Cap Equity Factor ETF (SMLF) had the best performance over all periods for the small-cap blend ETFs that met our criteria. The ETF provides exposure to U.S. small-cap stocks that focus on the value, quality, momentum and small-size factors. This strategy is more nuanced than that of the iShares Russell 2500 ETF (SMMD), which provides exposure to small- and mid-cap companies.
Foreign and Emerging Markets ETFs
Options within foreign categories are more limited. This is partially due to a smaller starting universe. There were no foreign growth ETFs that passed our screens, for instance.
Foreign large blend ETFs provide broad exposure, including growth companies. The iShares ESG Aware MSCI EAFE ETF (ESGD) had the best performance across all periods in this group. This is an ETF with an environmental, social and governance (ESG) tilt that invests in large- and mid-cap foreign stocks in Europe, Australia, Asia and the Far East. Its expense ratio of 0.20% is almost three times that of the iShares Core MSCI EAFE ETF (IEFA) but still below average for its category. The iShares Core MSCI EAFE invests in companies in the same countries of the same market-cap sizes but does not have the ESG tilt.
Table 2 also shows several options for a foreign large value ETF and foreign small/mid-cap blend ETFs.
One of the best-performing categories is the diversified emerging markets ETFs. Both ETFs in the table have above-average returns for all periods and low expense ratios for the category. The iShares MSCI Emerging Markets ex China ETF (EMXC) offers the broader exposure and also has higher total assets.
Intermediate-Term Bond ETFs
There were not many fixed-income ETFs that passed our screens. Within the taxable bond categories, we screened for intermediate core, intermediate core plus and intermediate government as well as short-term core and short-term government bond ETFs. It would be relatively easy for investors to fill gaps with a similar product from a different fund family.
The iShares Yield Optimized Bond ETF (BYLD) performed better than its peers across the three return periods. It is also one of only two ETFs in Table 2 to receive an Grade of A for all periods. It has an exceptional expense ratio (0.19%) compared to its category. The ETF holds a variety of short-, intermediate- and long-term bonds.
You will notice that the one ETF expense ratio with an A+ Investor Grade of C is included in the intermediate-term bond category. This is for the iShares 3-7 Year Treasury Bond ETF (IEI). We felt that, despite the grade, having a pure intermediate Treasury bond choice was important given the exposure suggested by the AAII Asset Allocation Models. The expense ratio of 0.15% is lower than many of the other ETFs depicted in the table. More importantly, the ETF’s performance is above average.
Short-Term Bond ETFs
Two investment-grade bond ETFs comprise the short-term bond category. These are options for investors who want exposure to that short end of the yield curve. In terms of targeted exposure, they are similar products. The iShares 0-5 Year Investment Grade Corporate Bond ETF (SLQD) tracks an index composed of dollar-denominated, investment-grade corporate bonds with remaining maturities of less than five years. The iShares 1-5 Year Investment Grade Corporate Bond ETF (IGSB) has a similar objective but with bonds that mature in one to five years. Expense ratios for both are on the lower side of those shown in Table 2.

Related

Portfolio Strategies
Using Fidelity Funds to Fill Your Asset Allocation Needs
Related

AAII InvestoGraphic
The Changes Made to AAII's Asset Allocation Models
Discussion
FREE REPORT

Get your free copy of our special
report analyzing the tech stocks
most likely to outperform the
market.
ROBERT A from NC posted over 2 years ago:
BARRY J from TX posted over 2 years ago:
Cynthia M from IL posted over 2 years ago:
CHARLES K from IL posted over 2 years ago:
You need to log in as a registered AAII user before commenting.
Log InCreate an account