


Related

AAII Sentiment Investing
Short interest reveals how defensively or complacently institutional investors are positioned.

Charles Rotblut leads a class in AAII's new Essential Investing Video Course. Go to https://www.aaii.com/ves for more information and to subscribe.
Ask most investors what high short interest means, and you’ll hear some version of this: “Too many people are betting against the stock, so it’s due for a short squeeze.” This conventional wisdom—that elevated short interest is a contrarian bullish signal—has misled many investors.
In May 2023, AAII Sentiment Investing’s Short Interest Diffusion Index (SIDI) hit a post-pandemic high of 1.625. Many investors expected an imminent decline. The S&P 500 index continued to climb for two more months, pulled back temporarily and then rallied to even higher levels. High short interest wasn’t predicting a crash—it was reflecting professional defensiveness even as markets climbed a “wall of worry.”
Research shows that aggregate short interest doesn’t work as a contrarian signal. Instead, it reveals informed professional positioning. When institutions pay significant costs to maintain short positions, they are making a calculated statement about risk levels. Understanding what drives short interest—and what aggregate levels tell us about institutional conviction—provides context that price charts alone never reveal.
Short selling allows investors to profit when stock prices decline. It involves selling shares you do not currently own. In simple terms, the steps of short selling are:
If the price falls from the time you sell the stock to the time you purchase it again, you profit. (You paid less for the stock than you sold it for.) If it rises, you lose. (You paid more for the stock than you sold it for.)
These outcomes are short selling’s defining characteristic: asymmetric risk. The most you can theoretically make is a 100% profit (Figure 1). This would occur if the stock became completely worthless, though, in reality, margin fees would eat into the profit.
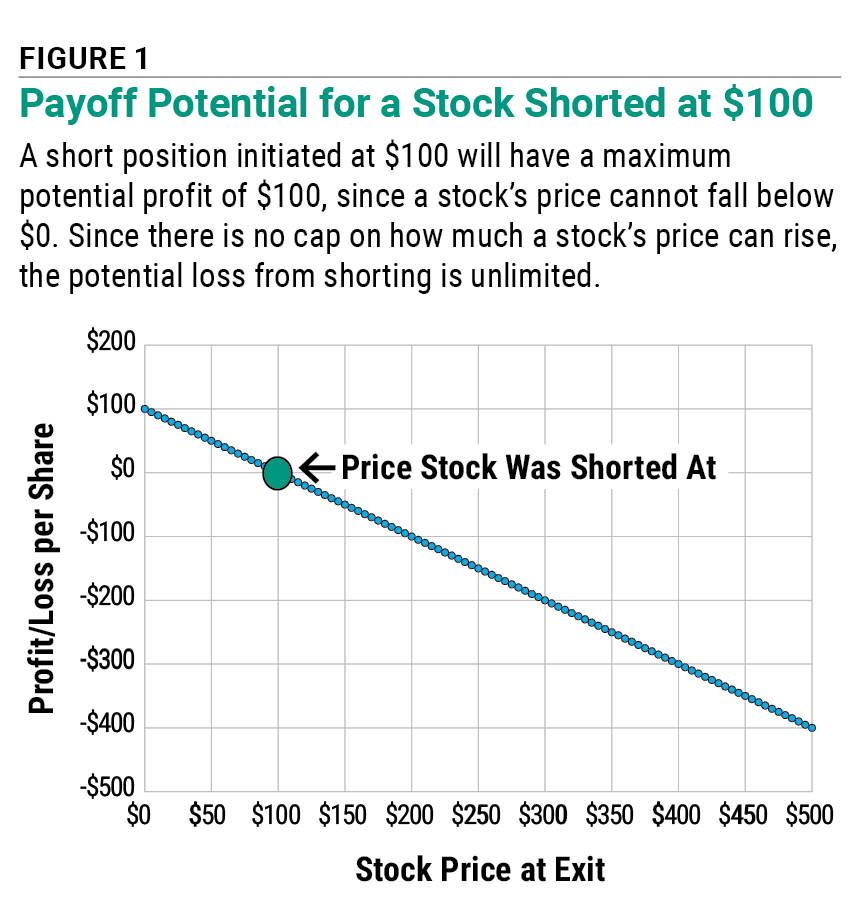
The maximum loss is unlimited. The more the stock rises, the greater your loss.
Short sellers face costs beyond margin interest. They pay fees to borrow shares, and those fees increase when many investors want to short the same stock. Furthermore, they must pay any dividends issued while holding the position, and they face opportunity costs on the capital used as collateral for the short sale.
Borrowing on margin requires having collateral. If the stock rises and losses mount, you’ll receive a margin call—a demand for more cash or securities. If you can’t meet it, your broker will force you to cover your position by buying back shares.
This forced covering creates short squeezes. When a heavily shorted stock rises, some short positions cover to limit losses. This buying pushes prices higher, triggering more margin calls and more covering. The cycle creates dramatic spikes unrelated to fundamental value.
GameStop Corp.  (GME) is the most well-known example of a short squeeze in recent history. Its price jumped from $17.25 per share on January 4, 2021, to over $500 per share by late January as meme traders coordinated to drive the stock up, forcing some short sellers to incur large losses.
The meme craze revealed another important characteristic of short selling: Timing matters. A long-term investor buying a stock only has to be right about the stock’s probability of rising in price. A short seller has to be right about both the stock’s probability of falling in price and the timing of when the decline will happen.
The costs and risks mean that maintaining short positions requires conviction. This is why aggregate short interest tells us something meaningful about professional sentiment.
Short sellers target specific characteristics. Stocks with elevated valuations relative to fundamentals—such as those with high price-earnings (P/E) ratios that are not supported by growth—attract shorts. Deteriorating business fundamentals like declining revenues, shrinking margins and weakening cash flows also draw attention, as do accounting red flags and aggressive financial reporting.
Short interest fluctuates with market conditions. During economic uncertainty, aggregate short interest rises as institutions adopt defensive positions such as increasing hedges.
Crisis periods demonstrate this clearly. During 2008 and March 2020, short interest spiked as institutions recognized the emerging risks. These weren’t predictions of crashes—they were responses, representing defensive action as problems became apparent.
Short selling has long been a key part of market dynamics. This has allowed researchers to determine its impact on market direction.
A comprehensive 2016 study by economists David Rapach, Matthew Ringgenberg and Guofu Zhou analyzed over 40 years of short interest data. They found that changes in aggregate short interest contain information about future market conditions. When aggregate short interest rises, subsequent returns tend to be lower. When it falls, returns tend to be higher.
Critically, the study’s insights accounted for detrending. Raw short interest has trended upward over the past few decades. Without accounting for this trend, levels can’t be compared across time. A 5% raw short interest reading in 2025 means something different than a 5% raw short interest reading in 1985. The study addressed this by asking whether current levels are high or low relative to recent norms, not decades-old levels.
The findings weren’t just statistical curiosities—they showed economic significance. Portfolio strategies incorporating short interest information generated better risk-adjusted returns than strategies ignoring this data.
High short interest is not a contrarian buy signal. Research doesn’t support the view that heavy shorting predicts rallies. Similarly, low short interest is not a sell signal.
Short interest does not predict precise market direction or timing. It doesn’t identify tops or bottoms with reliability. These limitations aren’t flaws—they’re realities about what the data represents.
Short interest reveals how defensively or complacently institutional investors are positioned. When aggregate short interest rises, professionals collectively spend more on hedges and other defensive positions. When it falls, they maintain less protection.
The conviction element matters because shorting incurs costs, as previously explained. Institutions won’t short a stock or other security without having a reasonable expectation of realizing a profit. This helps you interpret market moves.
A rally with high short interest means that the market is advancing despite institutional caution. A decline with low short interest suggests that institutions were caught with insufficient protection.
Studies show that short sellers demonstrate skill at fundamental analysis. They successfully predict negative earnings surprises and detect overvaluation before it becomes obvious. They also identify deteriorating fundamentals ahead of price declines.
Industry-level research shows similar patterns. Industries with elevated short interest relative to historical norms tend to underperform. When shorts are concentrated in a sector, they often signal concerns that prove justified.
When many institutions hold similar shorts and markets move against them, forced covering creates sharp reversals.
The rapid V-shaped recovery following the pandemic crash in February and March 2020 demonstrated how crowded positions create their own dynamics. As prices rebounded sharply following the 33-day bear market, margin calls forced covering, pushing prices higher and triggering more calls. These cascades create dramatic moves that can exceed what fundamental news alone would justify.
Raw short interest data presents challenges for assessing the market’s mood. What constitutes a “high” level of short interest varies dramatically across stocks and time periods. Short interest has trended upward over the decades. Additionally, small companies can have extreme percentages that distort aggregates, and daily fluctuations often reflect technical rather than meaningful factors.
The SIDI addresses these challenges systematically. It compares each company’s current short interest to its own one-year history. A stock normally at 3% short interest rising to 6% short interest represents significant change for that stock, even if 6% isn’t high in absolute terms.
This generates standardized scores indicating whether each stock’s short interest is elevated, normal or low relative to its typical level. The SIDI then weights these scores by market capitalization, ensuring that a mega-cap stock matters more than a micro-cap stock. This reduces noise and reflects the fact that institutional money concentrates in stocks that can easily be bought and sold in large dollar volumes.
The process aggregates these weighted scores market-wide and converts them to percentile rankings based on all historical readings. It adapts automatically—what was “high” decades ago might be “moderate” today.
Finally, the SIDI classifies readings into three categories: low (bottom 33% of historical readings), moderate (middle 33%) and high (top 33%).
When the SIDI shows low short interest, institutions feel comfortable with minimal hedging. Market rallies reflect broad confidence. Declines might catch institutions with insufficient protection.
High readings indicate defensive positioning. Rallies are climbing a “wall of worry”—advancing despite caution. Declines may be less severe if institutions already have protection.
Pay attention to transitions. Moves from moderate to high short interest signal rising institutional concern. Shifts from high to moderate short interest suggest growing comfort.
The SIDI cannot tell you when a market top or bottom is forming. It requires context from other indicators to be meaningful. Moreover, the data is backward-looking and delayed; it shows you where institutions were positioned, not necessarily where they are now. The SIDI also doesn’t reveal sector or stock-specific dynamics.
Short interest’s power emerges when combined with other indicators.
For example, short interest works well with price trends. A market above its moving average trendlines with low short interest suggests investors are confident that the upward momentum can continue. The uptrend is more fragile when short interest is high and the major indexes are above their moving averages.
To utilize short interest, add volatility measures to your analysis. The market environment is defensive when short interest is high while the CBOE Volatility Index (VIX) and the put-call ratio signal fear. Low short interest alongside low readings for these fear indicators suggest confidence.
Investors using short interest should also check breadth indicators. Broad participation plus low short interest suggests healthy confidence. Narrow leadership—that is, just a small proportion of stocks trading at new highs—with high short interest warns that strength is concentrated while institutions remain defensive.
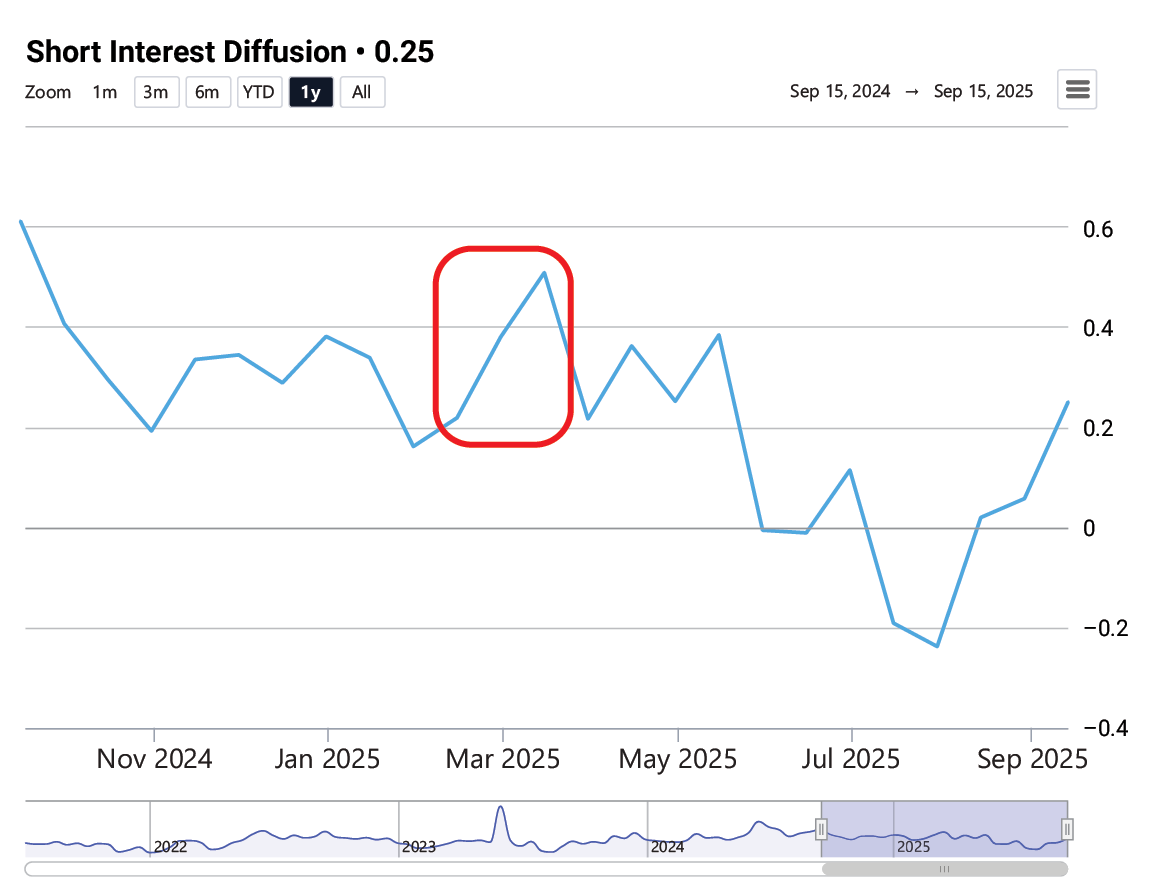
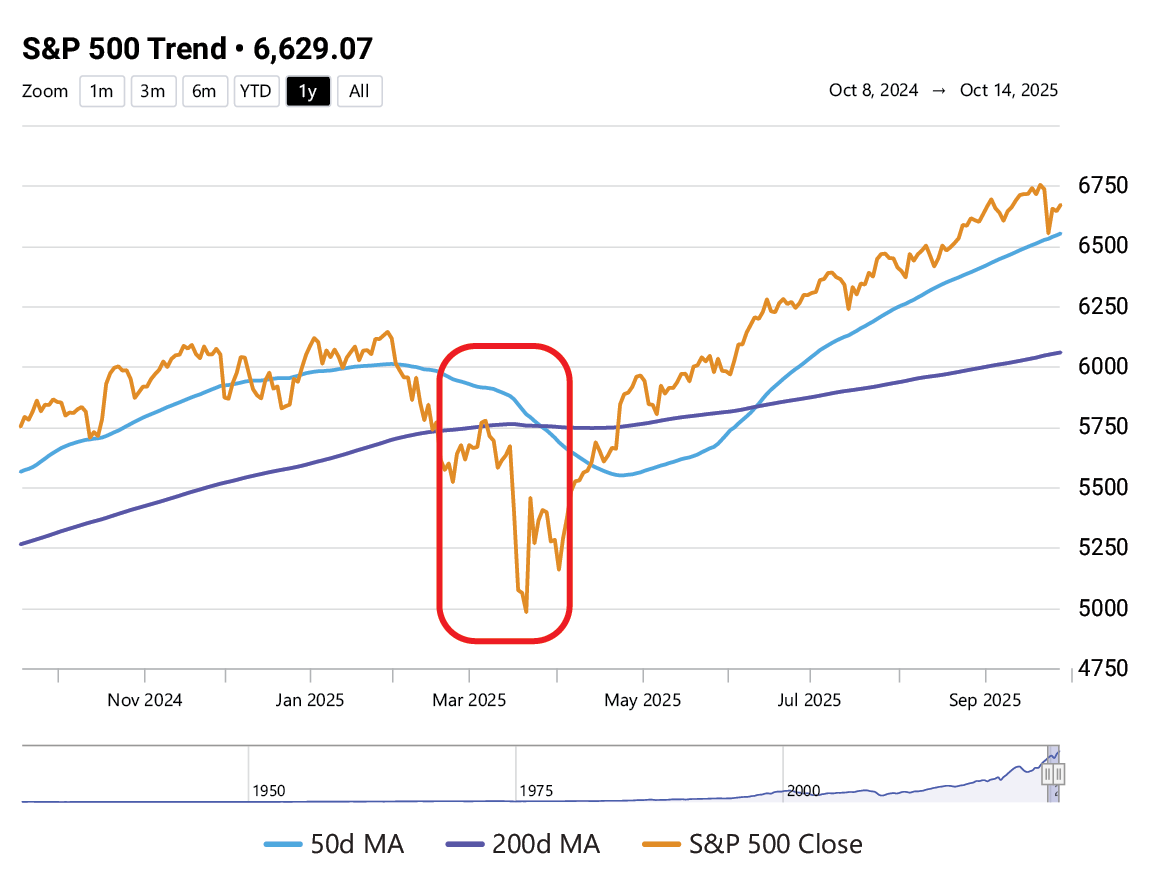
In March 2025, a high SIDI reading, a declining 50-day moving average and a rising VIX reading all coincided (see the box below). The ratio of new highs to new lows was also falling. This combination occurred against the backdrop of expectations for new tariff announcements. Investors at the time could have used these indicators to determine that the stock market had yet to fully price in the risks and anticipate further downside. Ultimately, the S&P 500 continued declining and didn’t bottom until early April.
Several indicators signaled market weakness in March 2025, including the Short Interest Diffusion Index (SIDI) and the S&P 500 index 50-day moving average (MA). Investors could have used these indicators to determine that the stock market had not yet fully priced in the expected announcement of new tariffs.
Source: AAII Sentiment Investing. Data as of 10/14/2025.
Lastly, those using short interest in their analysis should consider valuation. High valuations plus low short interest might signal dangerous complacency. High valuations plus high short interest suggest that institutions recognize risk being priced into stocks.
When incorporating short interest into your assessment of market conditions, think in terms of risk management rather than trading signals. When multiple indicators suggest elevated caution, consider whether your portfolio positioning matches your risk tolerance. When indicators suggest comfort, you might determine whether rebalancing to bring your equity allocation back up to your target is appropriate.
No single indicator tells the complete story. The SIDI reveals institutional positioning. Price trends show momentum. Breadth shows participation. Volatility shows uncertainty. Valuation shows optimism about future earnings. Together, they create a mosaic far more valuable than any single indicator.
Short selling reflects professional conviction. The asymmetric risk, ongoing costs and complexity mean institutions don’t maintain significant short positions casually. When aggregate short interest changes, it reveals how institutional investors view current conditions.
Research spanning decades confirms that changes in aggregate short interest contain information about market dynamics. The SIDI makes this research accessible by providing signals twice monthly about whether institutional positioning is defensive, normal or complacent.
Short interest signals aren’t predictive. The SIDI’s value lies in providing context, not directions. It tells you about the backdrop against which market moves occur. Understanding whether institutions are heavily hedged or carrying minimal protection helps you interpret markets more effectively.
Use short interest as one piece of comprehensive sentiment analysis. Combine it with price trends, volatility measures, breadth indicators and valuations. This disciplined, multifactor approach leads to better decisions than chasing individual signals.
The AAII Sentiment Investing Dashboard provides regular SIDI updates alongside other sentiment and market indicators, helping you build that complete picture. Understanding what professionals are doing with their capital—and what that positioning means for your decisions—is a valuable edge in navigating complex markets.
AAII Sentiment Investing

AAII Sentiment Investing

AAII Sentiment Investing

V N from FL posted 11 months ago:
JOHN L from NJ posted 11 months ago:
You need to log in as a registered AAII user before commenting.
Log InCreate an account