


Related

PRISM Wealth-Building Process
Easily identify the perfect fund for your portfolio with these tips and tools.

Charles Rotblut leads a class in AAII's new Essential Investing Video Course. Go to https://www.aaii.com/ves for more information and to subscribe.
Choosing an exchange-traded fund (ETF) or a mutual fund takes a bit of analysis, but the process doesn’t have to be complicated. Here, we make it easy with some simple guidelines to help you decide which funds are right for you. In addition, we highlight some of AAII’s tools and resources that can make your decisions a cinch.
There are two broad starting points that will serve you well as rules to follow. The first is to decide what your allocation needs are.
AAII’s Asset Allocation Models provide sample allocation strategies for three types of investors: aggressive, moderate and conservative. The models use varying combinations of large-cap, mid-cap, small-cap, international and emerging markets stocks, along with intermediate- and short-term bonds.
Below the models are ideas for the types of ETFs and mutual funds an individual investor can use to implement such strategies in a real-world portfolio. Additional ideas can be found in our AAII Asset Allocation Models article series. Allocation (“balanced”) funds and target-date funds can be used instead by those who would prefer to have a fund manager make the allocation decisions.
The PRISM Wealth-Building Process can help you decide on the appropriate allocation for each of your goals. This five-step process helps to create a personalized investment policy statement to guide your investing decisions and achieve your goals. To access PRISM and participate in the helpful PRISM Academy, go to the Learn and Plan page.
The second rule is to start with broad-based index funds. These ETFs and mutual funds are typically the biggest and lowest-cost offerings within their respective categories. They tend to offer the benefits of low expense ratios, tax efficiency, highly diversified portfolios and above-average long-term performance.
Not all index funds are the same, so it’s important to look at which index a fund is following. Many ETFs follow indexes specifically designed for them to track. If you are unfamiliar with a certain index, type the index’s name plus the word “methodology” into a search engine such as Google. This will typically lead you to a document explaining what the index is designed to track.
If you are comfortable with or prefer active management, you can expand the universe of ETFs or mutual funds you consider. When doing so, be cognizant of the data showing how relatively few actively managed funds are successful at beating their broad-based index counterparts over longer periods of time.
ETFs and mutual funds provide individual investors access to professionally managed, diversified portfolios at a low cost.
However, there are structural differences separating the two types of investments. ETFs trade like stocks on an intraday basis. Investors incur trading costs such as the bid-ask spread (the difference between what buyers are offering and sellers are asking). Plus, when selling an ETF, investors can immediately reinvest the proceeds.
ETFs are bought and sold from other investors. The purchase of an ETF on the open market does not add dollars to the fund’s portfolio, nor does the selling of an ETF lead to an outflow of dollars.
Rather, ETF sponsors issue and redeem shares based on interactions with authorized participants (APs). APs are typically large institutional investors. Based on demand, APs can either request creation units from the ETF sponsor or redeem them. A creation unit typically comprises 25,000 to 200,000 shares of the ETF. The actual transaction involves either a basket of securities matching the ETF’s portfolio, cash or a combination of the two.
These transactions occur on an intraday basis and help to keep the market price of an ETF’s shares close to its underlying net asset value (NAV, the value of the assets each fund’s share represents).
There’s quite a bit of information in the previous paragraphs. The first big takeaway is that there are intermediaries between an ETF and the actual investors who are buying and selling shares of the fund on the open market. The second is that while ETFs may trade at or close to their NAV, there is never a guarantee of your purchase or sell transaction being executed at the NAV.
Mutual funds are bought and sold only at the end of each trading day. The prices of mutual fund shares are also updated at the end of the day. When an investor places an order to purchase or redeem shares, the order is not executed until the end of the trading day. These purchase and sell orders are always executed at a mutual fund’s end-of-day NAV. Transaction costs are limited to any loads, redemptions or brokerage fees charged, but the dollars from such trades cannot be reinvested immediately, except into another mutual fund.
Dollars from purchases flow directly into the mutual fund. Sell orders pull money out of the mutual fund. This is why flows are often tracked. An increase in demand from investors gives a mutual fund’s manager(s) more capital to invest. Redemptions reduce the amount of capital to invest. If redemption requests are high enough, a mutual fund manager may have to sell some of the portfolio’s holdings to free up cash to fulfill the requests.
The structure of mutual funds can also lead to capital gains distributions being passed on to shareholders. These are profits from the sale of securities realized by the mutual fund that were not offset by realized losses. Investors have no control over the timing of such distributions, and there are years when mutual funds can have both disappointing returns and capital gains distributions. ETFs can also pass along capital gains distributions, but because they often fulfill redemption requests by giving APs securities from their portfolio instead of selling them, capital gains are realized less often.
So, given all of the above, how do you decide whether to use an ETF or a mutual fund?
Part of the decision rests on the type of account you are using. Participants in workplace retirement plans such as 401(k)s are generally limited to mutual funds or a hybrid known as a collective investment trust (CIT). Most robo-advisers use ETFs. If you have an account with a mutual fund provider, then your options depend on whether the firm has a brokerage arm. Charles Schwab, Fidelity, T. Rowe Price and Vanguard are among the fund families that allow the purchase of stocks and ETFs in addition to mutual funds.
(Our current expectation is that when other mutual fund companies join Vanguard in offering ETF share classes of existing mutual funds, potentially later this year, investors will need brokerage accounts to hold those ETF shares. This is currently the case at Vanguard.)
Discount brokers do not charge any commissions on ETF trades. Most also offer transaction-free trading on many mutual funds. Check with your broker to determine if the mutual fund you are interested in is on their no-transaction-fee list.
Mutual funds are purchased in dollar amounts. This makes dollar-cost averaging easier and avoids the problem of having odd amounts of cash sitting uninvested. ETFs are generally bought and sold on a per-share basis. This may make it harder to fully invest all of your cash. (Some discount brokers allow fractional share purchases.)
As previously noted, ETFs generally have the advantage when it comes to taxes. This is not universally the case. Mutual funds following broad indexes, such as the S&P 500 index, may also have low tax-cost ratios. For instance, Vanguard 500 Index Admiral fund  (VFIAX) has a three-year tax-cost ratio of just 0.3%. This means that shareholders in the highest tax bracket saw their returns reduced by three-tenths of a percentage point due to taxes.
If trading on an intraday basis is important, ETFs may be preferable. Reasons why this would matter include trading strategies and a desire to use ETFs as a placeholder in a portfolio until a new stock can be found. Pay attention to trading volume. ETFs that are less frequently traded may have wider bid-ask spreads and may require more time to have orders fully executed. We suggest using limit orders when buying or selling ETFs.
A final consideration is the type of strategy preferred. Active management largely remains the domain of mutual funds, though more and more actively managed ETFs are being launched. The U.S. Securities and Exchange Commission (SEC) is reviewing requests to offer ETF share classes of mutual funds, and approvals could significantly increase the number of actively managed ETFs. Factor, cryptocurrency, thematic and specialized strategies are often the domain of ETFs.
In many cases, ETFs and mutual funds can be interchanged. We at AAII think investors should focus more on finding the right fund for their allocation needs instead of whether it is an ETF or a mutual fund.
Regardless of the type of fund you choose, be cognizant of the influence that market conditions have on returns. The returns of any fund—or investing strategy for that matter—are significantly influenced by the performance of its asset class.
Table 1 shows the performance of major domestic stock, foreign stock and bond indexes. These provide a benchmark for setting expectations about how particular funds should have performed.
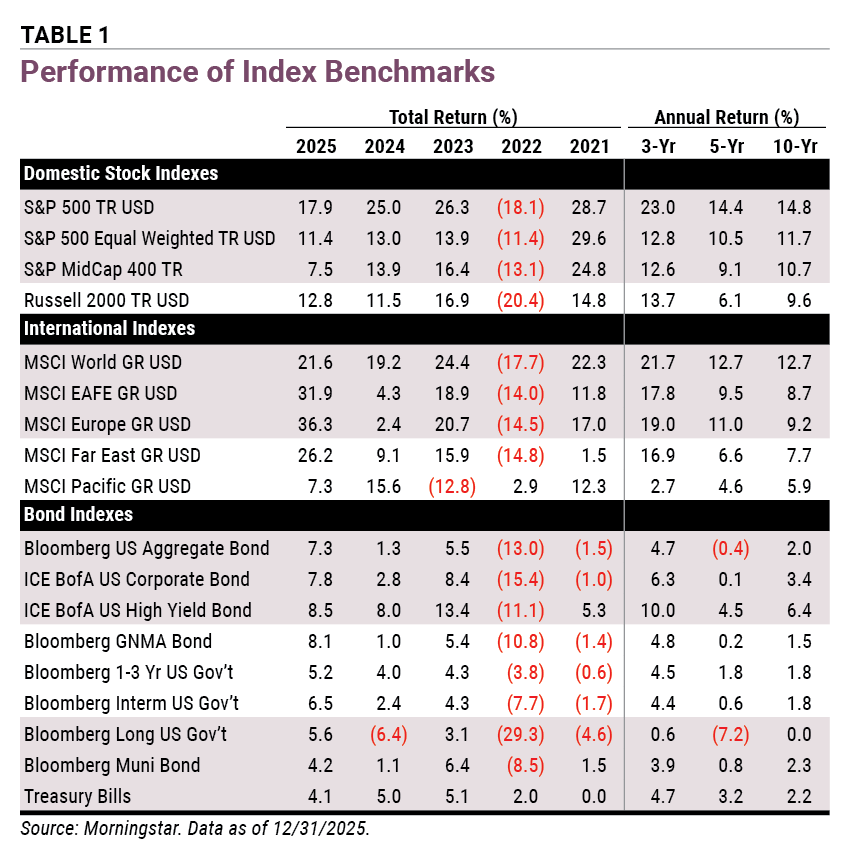
There are two things beyond performance to notice for the most recent year. First, no one index has the highest returns every single year. In 2025, four of the five international indexes shown in Table 1 outperformed the S&P 500 for the first time since 2022. The ever-changing leadership among fund asset class categories shows why diversifying across asset classes and fund groups is important.
The second thing to look at is the variation in returns. Foreign stocks, as measured by the MSCI EAFE (Europe, Australasia and the Far East) index, jumped to 31.9% in 2025 after realizing a modest 4.3% return in 2024.
These markets lack the exposure to big technology companies that the S&P 500 has. The MSCI EAFE itself is also composed of a broad mix of economies that do not move in lockstep with the U.S. The currency markets also play a role, with a weaker U.S. dollar increasing the returns that U.S. investors realize on foreign stocks.
The expanded ETF and mutual fund guides on AAII.com provide information on 4,900 ETFs and over 20,800 mutual funds. The ETF universe includes leveraged and inverse funds as well as exchange-traded notes (ETNs). The universe of mutual funds covered includes investor, institutional, adviser and retirement mutual funds. Both load and no-load mutual funds are covered.
The online interface not only groups key data into individual tabs, it also allows you to limit the number of fund categories that appear as well as search for a specific fund. We’ve also added additional information on each fund, including alpha and, for ETFs, year-to-date tracking error.
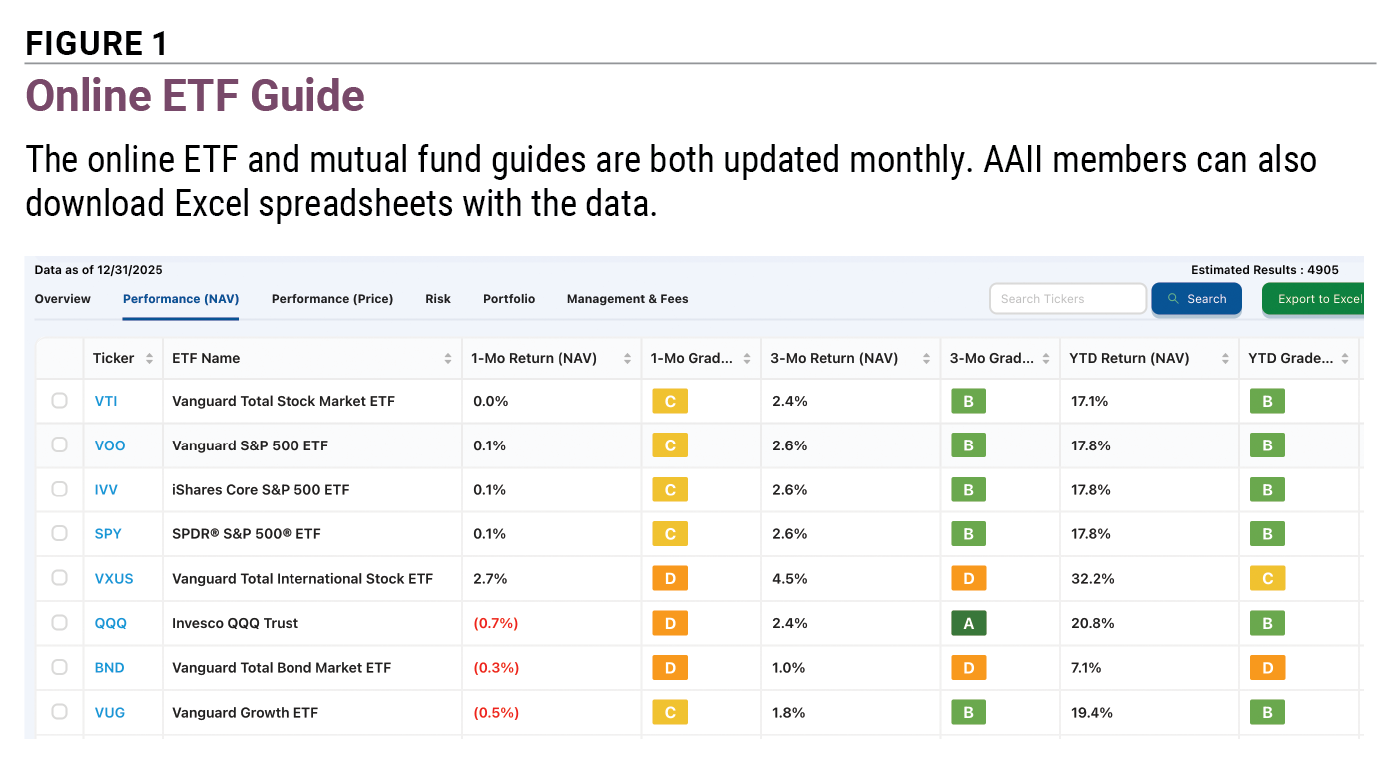
You can access the ETF guide and the mutual fund guide at AAII.com. Both guides provide the option to download the data in spreadsheet format via a green Export to Excel button (Figure 1).
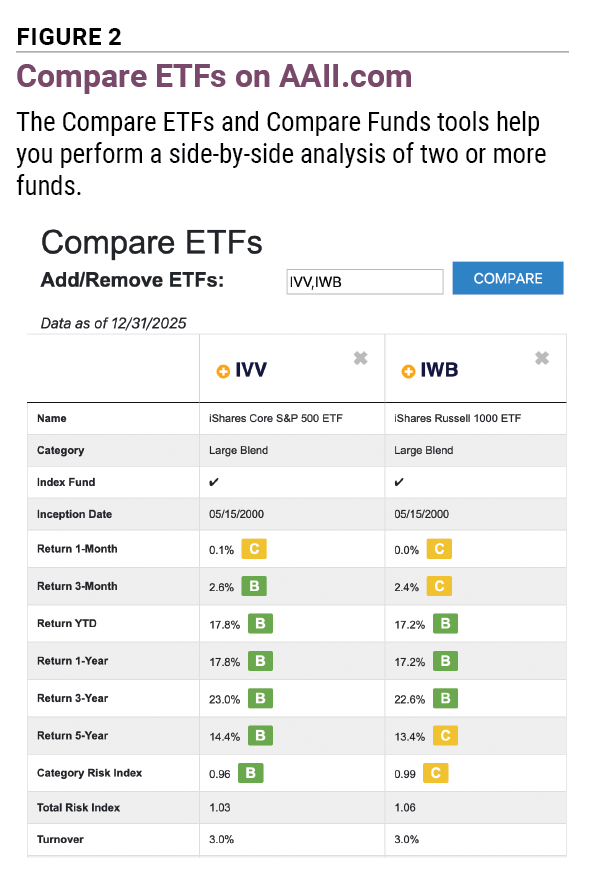
To compare one or more funds, just click on the checkbox located on the far left-hand side next to each ticker, and then click the Compare button. This will call up the Compare ETFs or Compare Mutual Funds tool, respectively. As shown in Figure 2, the tools help you perform a side-by-side analysis of two or more funds. You’ll be able to compare returns, risk, portfolio turnover and expenses. You can also directly access either Compare tool by going to Compare ETFs and Compare Funds, respectively, and type in your tickers.
AAII members wishing to research a single fund can use our ETF and Mutual Fund Evaluators. To access them, type the name or ticker of the fund into the search box at the top left of AAII.com; when the fund appears in the autofill drop-down list, click on its name.
The Evaluator page gives you detailed information about the fund. Here, you will find important statistics such as the fund’s size, yield, expense ratio and—for mutual funds—the minimum initial purchase amount. You’ll also notice the fund’s grades. These grades measure a fund’s returns and risk against its peers. Grades of A or B signal that the fund is performing better than its category peers for a specific statistic, such as three-year return. Grades of D or F signal that the fund is worse than its category peers.
The letter grades are calculated by segmenting the funds in each ETF and mutual fund category into quintiles (20% increments) and then assigning a grade of A for ETFs and mutual funds that rank in the best 20% for any field. A grade of F is assigned for funds that rank in the worst 20% for any risk and expense fields (for their overall categories).
The ETF and Mutual Fund Evaluators provide annual performance data for the last 10 years (if the fund has existed that long), along with grades showing how the fund stacks up against other funds in its category on a year-by-year basis for performance. Standard deviation, total risk index, beta and category risk index are displayed along with each factor’s grades to give you insights about a fund’s risk profile. R-squared represents the percentage of a fund’s movement that can be explained by movements in the S&P 500. Higher readings imply that the fund is more closely tracking the large-cap index.
A+ Investor and AAII Platinum subscribers have access to our ETF and Mutual Fund Screeners, which allow you to select from a plethora of filters to identify funds that match your needs. Additionally, A+ Investor and Platinum subscribers can access our library of prebuilt First Cut ETF and Mutual Fund screens.
These are brief definitions of some of the terms and statistics used in the fund guides. Complete field definitions can be found at the online ETF and mutual fund guides.
Return (%): Total return percentages for each calendar year and average annualized returns for three-, five- and 10-year periods ending December 31, 2025. Returns are based on NAV for both ETFs and mutual funds.
Total Risk Index: The total risk index is the standard deviation of a fund’s return divided by the average standard deviation of return for all funds. Standard deviation is a measure of return volatility and is computed using monthly returns for the last three years. A value of 1.00 denotes average risk. Values above 1.00 indicate greater-than-average risk, while values below 1.00 indicate less-than-average risk. Risk numbers that are in the lowest 20% of all funds within the investment category are awarded a grade of A.
Expense Ratio (%): The sum of administrative fees and, for mutual funds, adviser management fees and 12b-1 fees, divided by the average NAV of the fund, stated as a percentage. Brokerage costs incurred by the fund are not included in the expense ratio but are instead reflected directly in the NAV. Front-end loads, back-end loads, redemption fees and account activity charges are not included in this ratio. Some funds are “funds of funds,” so their expense ratios will not reflect the expenses of all funds held by the fund.
Portfolio Turnover (%): A measure of the trading activity of the fund, computed by dividing the lesser of purchases or sales for the year by the monthly average value of the securities owned by the fund during the year. Securities with maturities of less than one year are excluded from the calculation. The result is expressed as a percentage, with 100% implying a complete turnover within one year.
PRISM Wealth-Building Process

AAII How-To

Mutual Funds

BARRY J from TX posted 8 months ago:
You need to log in as a registered AAII user before commenting.
Log InCreate an account