


The Problem With a Rising Equity Glide Path
Comment on “Mathematical Support for Rising Equity Glide Paths,” by Luke Delorme, in the September 2015 AAII Journal.
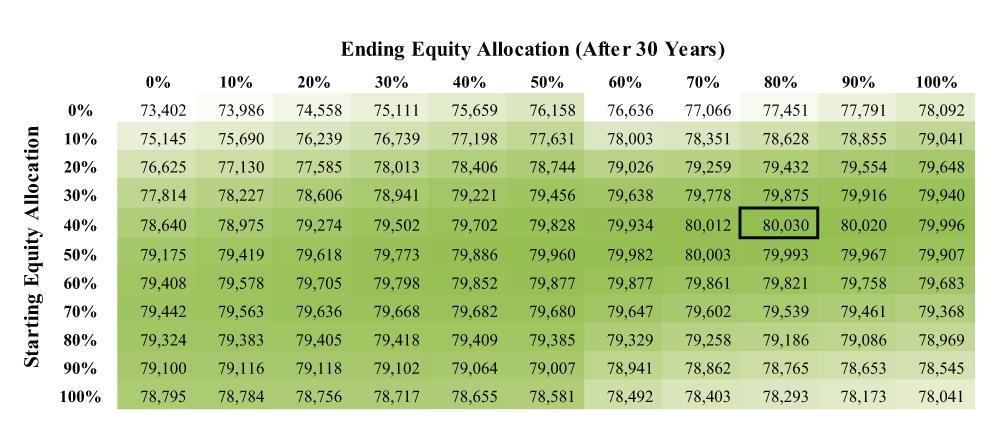
Luke Delorme makes a case for a rising equity glide path. In Figures 1 and 4, his evidence shows the optimal case for 20%-to-70% and 40%-to-80% paths. Readers should ponder the implication. Toward the end of our lives, do we really want to bear the risk of a portfolio of 70% to 80% in stocks? The bear markets of 2000–2002 and 2007–2009 saw stock declines of 40% to 50%. Thus, equity portfolios of 70% to 80% could quickly lead to 35% to 40% portfolio losses, in which case the goal of passing along a legacy to adult children, grandchildren and charities could all be for naught.
—John Micetich from San Diego, CA

Using Median P/E Values to Assess Stocks
Comment posted to “Using Rational Value to Judge a Stock’s Worth,” by Ellis Traub, in the October 2015 AAII Journal.
The table discusses using the Excel MEDIAN function to generate a signature price-earnings ratio of 20.8. Normally, medians are an actual value, but there is no 20.8 in this data series. It should be pointed out, however, that when there is an even number of values, the MEDIAN function averages between the two innermost values. Thus, the signature price-earnings ratio is closer to an average than a median.
—Paul Stadnik from Oregon
Ellis Traub responds:
You’re quite right, Paul, that the median is the midpoint between the two middle values, when the number of values is an even number—but it’s not the same as the average of the entire series.
Our goal is to approximate a number that has as many transactions above as below it, and the median serves that purpose well. (Try calculating the median and the average of the figures in the example if the highest price-earnings ratio were to be 60.5.)
But let’s not strain at gnats here. I use a Flair pen rather than a sharp pencil when I draw these lines, and an approximation is fine, as long as you’re consistent with the way you calculate it. If you know approximately what a stock is worth, you’re way ahead of the herd that doesn’t have a clue.
Judging True Value Amid Falling Prices
Comment posted to “Finding Bargains Among Stocks With Falling Stock Prices,” by Luke Wiley, in the October 2015 AAII Journal.
A significant problem with this approach are the first four filters. How do you know a company has a durable advantage and that it will continue to make money at the rate it has in the past? An efficient market takes these considerations into account. A low price may mean that the answer is “no,” not just that there is too much inappropriate pessimism. How can you tell the difference?
—Russell Abbott from California
Analysis Beyond a 52-Week Low Screen
Comment posted to “Wiley’s 52-Week Low Strategy,” the First Cut column by John Bajkowski, in the October 2015 AAII Journal.
A stock may reach its 52-week low for some underlying reason that does not show on any screen. A screen does not replace a full-blown analysis. I had some success with a similar strategy with the following differences: I did not use long-term debt, I used year-over-year earnings growth for the last two quarters, and I used a price between 3% and 10% above the 52-week low.
—Patrick Nicolas from California
Questioning Active ETFs
Comments posted to “Why Aren’t There More Active ETFs?,” by Charles Rotblut, CFA, in the October 2015 AAII Journal.
In general, why would you want active management? It is not as good as indexing, and it is much more expensive.
— Bernard Scoville from California
Wouldn’t a closed-end fund offer some of the characteristics of an actively managed ETF?
— David Knoll from Indiana
Charles Rotblut, responds:
A closed-end fund does lack the same tax efficiency that ETFs have. You will also have a greater chance of a closed-end fund straying from its net asset value, which can be a positive or a negative.
Discussion
FREE REPORT

No comments have been added yet. Add your thoughts to the discussion!
You need to log in as a registered AAII user before commenting.
Log InCreate an account