


Related

Feature
Your withdrawal strategy should be optimized to take into account potential spikes in marginal tax rates caused by factors like taxation of Social Security benefits and income-based Medicare premiums.

Consider a retired household with funds in a taxable account, a tax-deferred account such as a 401(k), and a Roth account such as a Roth IRA. If this household follows the conventional wisdom withdrawal strategy, they would withdraw all funds from their taxable account until exhausted. They would then withdraw all funds from their tax-deferred account until exhausted before finally withdrawing all funds from their Roth account until exhausted.
This conventional wisdom withdrawal strategy is tax-inefficient. In the early retirement years when funds are withdrawn from the taxable account, the household is likely in a low tax bracket—perhaps the 0% tax bracket. This would occur if their adjusted gross income (AGI) is less than their standard deduction because withdrawals from taxable accounts are largely tax-free withdrawals of principal. In the middle retirement years, when funds are withdrawn from tax-deferred accounts, the household will likely be in a relatively high tax bracket. If the household has Roth accounts, then in late retirement years when tax-free funds are withdrawn from these accounts, the household will probably be in the 0% tax bracket. A more tax-efficient withdrawal strategy would be to move some of the tax-deferred account withdrawals to the early and late retirement years to fill low tax brackets.
Fidelity and Charles Schwab recommend using proportional withdrawal strategies in retirement. These involve taking proportionate withdrawals from all accounts. Although there are some differences between the proportional withdrawal strategies recommended by Fidelity and Schwab, they are each built on the idea that households can improve upon the conventional wisdom withdrawal strategy by moving some tax-deferred account withdrawals to fill low tax brackets in some retirement years. Notice, proportional withdrawal strategies are based on the idea of managing tax brackets during retirement.
Here, we explain why most retirement households face marginal tax rates that are substantially different from their tax bracket, where the marginal tax rate is the tax rate on a dollar of ordinary income adjusted for Social Security and Medicare thresholds. Then, in a forthcoming article, we will illustrate and explain why a tax-efficient withdrawal strategy requires households to consider marginal tax rates when planning withdrawals in their retirement years. Since the conventional wisdom and proportional withdrawal strategies fail to consider marginal tax rates, they are far from optimal withdrawal strategies.
The taxation of Social Security benefits can cause lower- and moderate-wealth single households’ marginal tax rates to be 150% or 185% of their tax bracket on a wide range of their income. Although this example is for a single household, the same lessons apply to married couples.
The amount of a household’s Social Security benefits that is included in AGI depends upon the household’s level of provisional income (PI). By definition, PI = modified adjusted gross income (MAGI) + one-half Social Security benefits + tax-exempt interest. The term MAGI appears in various places in the tax code, but its definition changes with each use. Thus, we use MAGIpi to denote this definition. For most retirees, MAGIpi consists of everything in adjusted gross income after deducting the taxable amount of Social Security benefits.
There are two provisional income threshold levels for singles, heads of households and qualifying widow(er)s with a dependent child (henceforth, singles). They are $25,000 and $34,000. These provisional income threshold levels have been held constant from year to year. For a single household, the amount of Social Security benefits included in AGI is the lowest of three amounts: 1) 85% of Social Security benefits; 2) $0.50 for each dollar of provisional income between $25,000 and $34,000 plus $0.85 for each dollar of provisional income above $34,000; 3) half of Social Security benefits plus $0.85 for each dollar of provisional income above $34,000.
One goal of Table 1 is to show the range of non-Social-Security income for this single individual that, due to the taxation of Social Security benefits, is subject to federal marginal tax rates that are 150% or 185% larger than the tax bracket the taxpayer is in. To avoid the complexities associated with the taxation of qualified dividends and long-term capital gains, we assumed non-Social-Security income consists entirely of ordinary income (e.g., tax-deferred account withdrawals, taxable pension income, earned income and taxable interest). The calculations in Table 1 that show the levels of non-Social-Security income that place this single household’s income at the top of tax brackets may be somewhat off for certain single households. However, the rising and falling pattern of marginal tax rates in retirement due to the taxation of Social Security benefits and Medicare income-related monthly adjustment amounts (IRMAAs) is not affected by our simplifying assumption. Thus, it does not affect the major lessons from this study.
Table 1 illustrates the difference between single Nancy’s federal-alone tax bracket and her federal-alone marginal tax rate on her last dollar of income at various levels of non-Social-Security income, where all amounts are rounded to the nearest dollar. Her 2023 annual Social Security benefits will be $32,400 and we assume she lives in a tax-free state. This would be her annual benefit level if she has a monthly primary insurance amount (PIA) of $2,700 and begins her benefits at her full retirement age (FRA).
At non-Social-Security income of $13,400, Nancy’s provisional income is $29,600 [$13,400 + (0.5 × $32,400)]. So, $2,300 of her Social Security benefits are included in AGI [0.5 × ($29,600 – $25,000)]. Assuming she is at least 65 at the end of 2023, her standard deduction of $15,700 offsets this AGI. Thus, her tax bracket and marginal tax rate are 0% for each dollar of non-Social-Security income of $13,400 or less assuming annual Social Security benefits of $32,400.
For each additional dollar of non-Social-Security income between $13,400 and $17,800, an extra $0.50 of Social Security is included in AGI. Thus, her taxable income rises by $1.50 ($1 of non-Social-Security income plus $0.50 cents of Social Security income). Because she is in the 10% tax bracket, her taxes go up by $0.15 to reflect a marginal tax rate of 15% (10% bracket × 1.50).
At non-Social-Security income of $17,800, her provisional income reaches the second PI threshold level of $34,000. Each additional dollar of non-Social-Security income between $17,800 and $20,178 causes another $0.85 of Social Security benefits to be taxed. Thus, her taxable income rises by $1.85. Because she is in the 10% tax bracket, her taxes go up by $0.185. Her marginal tax rate is 18.5% (10% × 1.85).
At non-Social-Security income of $20,178, her taxable income reaches the top of the 10% tax bracket. Each additional dollar of non-Social-Security income between $20,178 and $38,408 causes another $0.85 of Social Security benefits to be taxed. Thus, her taxable income rises by $1.85. Since she is in the 12% tax bracket, her marginal tax rate is 22.2% (12% × 1.85).
At non-Social-Security income of $38,408, her taxable income reaches the top of the 12% tax bracket. Each additional dollar of non-Social-Security income between $38,408 and $44,906 causes another $0.85 of Social Security benefits to be taxed. Thus, her taxable income rises by $1.85. Since she is in the 22% tax bracket, her marginal tax rate is 40.7% (22% × 1.85).
At non-Social-Security income of $44,906, 85% of her Social Security benefits are taxed, which is the maximum. The tax torpedo refers to the income range where her marginal tax rate is 150% or 185% of the tax bracket. Thus, for Nancy, the end of the tax torpedo occurs at this non-Social-Security income level. At the end of the tax torpedo, her marginal tax rate on additional dollars of non-Social-Security income falls sharply from 185% of her tax bracket to her tax bracket.
In short, due to the taxation of Social Security benefits, Nancy’s marginal tax rate is 150% of her tax bracket for non-Social-Security income between $13,400 and $17,800. More important, it is 185% of her tax bracket for non-Social-Security-income between $17,800 and $44,906, which is an income range of $27,106. Nancy’s total income—that is, non-Social-Security income plus annual Social Security benefits—at the end of the tax torpedo is $77,306. Thus, many single clients of financial advisers have non-Social-Security income between $13,400 and $44,906, which would place them within this tax torpedo.
Based on 2023 tax brackets, the taxation of Social Security benefits causes Nancy’s federal marginal tax rate on a range of income at the end of the tax torpedo to be 40.7%, which is 18.7% higher than her tax bracket. However, based on the scheduled expiration of the Tax Cuts and Jobs Act (TCJA), her federal-alone marginal tax rate at the end of the tax torpedo will rise to 46.25% (25% bracket × 1.85) beginning in 2026 if the TCJA’s lower tax brackets are not extended. This is 21.25% higher than her federal tax bracket beginning in 2026. Moreover, if she lives in a state that imposes an income tax, then her federal-plus-state marginal tax rate on a range of her income at the end of the tax torpedo could easily exceed 50%.
In short, beginning in 2026 and continuing for the rest of Nancy’s life, her federal-alone marginal tax rate on a range of income at the end of the tax torpedo will likely be at least 21.25% higher than her tax bracket due to the taxation of Social Security benefits. If she lives in a state that imposes an income tax, especially one of the 13 states that also taxes Social Security benefits, then her federal-plus-state marginal tax rate on a range of her income near the end of the tax torpedo could easily exceed 50%.
The remaining rows of Table 1 will be discussed further on in this article.
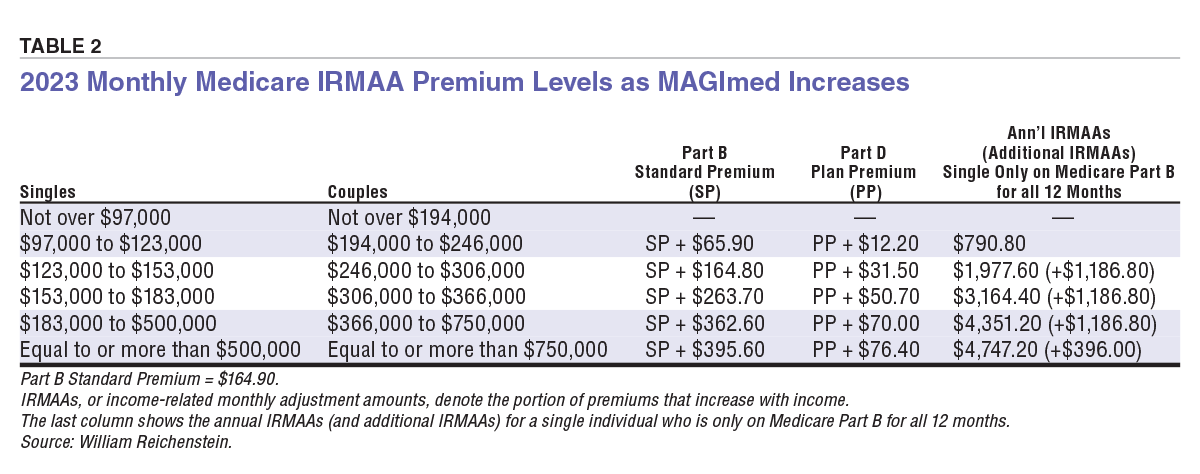
The Affordable Care Act (ACA) instituted higher Medicare premiums for retirees as their income level increases. The IRMAAs denote the portion of premiums that increase with income. Each time a retiree’s income surpasses one of five income threshold levels, their annual Medicare premiums for two years hence rise substantially. These income-related increases in Medicare premiums are effectively increases in a retiree’s federal income taxes. Thus, these IRMAAs represent huge increases in a retiree’s marginal tax rates when their income (from two years earlier) exceeds any one of the five income threshold levels.
In general, Medicare premiums for one year are based on MAGI levels from two years ago. As noted earlier, the term MAGI is used in various places in the tax code, but its definition varies with each use. Consequently, we use MAGImed to denote the definition of MAGI as used to determine the level of Medicare premiums. MAGImed is defined as adjusted gross income plus tax-exempt interest.
Table 2 shows how monthly 2023 Medicare premium levels increase when 2021 MAGImed levels breach the 2023 income threshold levels of $97,000, $123,000, $153,000, $183,000 and $500,000 for single taxpayers. Except for the last income threshold level, these threshold levels are twice as high for married couples: $194,000, $246,000, $306,000, $366,000 and $750,000.
For taxpayers filing as single in 2023 with MAGImed in 2021 of $97,000 or lower, the standard premium for Medicare Part B applies and, when applicable, the plan premium for Medicare Part D (drugs) applies. The additional dollar of income that caused their MAGImed to exceed $97,000 in 2021 increases their 2023 Part B premium by $65.90 per month and increases their Part D premium, if applicable, by $12.20 per month. Assuming these single taxpayers are only on Medicare Part B for all 12 months of 2023, their annual premium will rise by $790.80 [$65.90 × 12 months]. They will have owed an additional $0.22 of income taxes in 2021 on their last dollar of income. Thus, the dollar of 2021 income that caused their 2021 MAGImed to exceed $97,000 will cause them to pay $791.02 more to the federal government ($790.80 + $0.22).
The spikes in marginal tax rates get worse. The dollar of income that caused 2021 MAGImed to exceed $123,000, $153,000 and $183,000 will cause 2023 annual Part B premiums to increase by $1,186.80.
For a married couple filing jointly when both partners are only on Medicare Part B for all 12 months of 2023, the dollar of income that caused their 2021 MAGImed to exceed the second, third or fourth MAGImed threshold levels will increase their 2023 annual Medicare premiums by at least $2,373.60.
This single taxpayer’s 2023 level of MAGImed will likely determine the 2025 level of Medicare premiums. But the precise MAGImed income threshold levels for 2025 will not be known until October 2024 and these income levels may be higher than the 2023 threshold levels. We encourage households to leave a comfortable margin for error when trying to manage their level of MAGImed for 2023. The reason is if this income measure for a single individual exceeds any of the MAGImed income threshold levels for 2025, then the annual Medicare premiums two years hence would rise sharply. Thus, to leave a comfortable margin for error, we calculated the MAGIpi levels that would produce 2023 MAGImed levels that exceed $97,000 and $123,000 in Table 1, even though the MAGImed income threshold levels for 2025 may be higher. These spikes may result in marginal tax rates in excess of 79,102% and 118,704% on the additional dollar of income above the threshold levels, which are the estimated marginal tax rates in Table 1.
Returning to Table 1, at non-Social-Security income of approximately $69,460, Nancy’s 2023 MAGImed would exceed the first MAGImed income threshold level of $97,000, ($69,460 + 0.85 × $32,400). Thus, if she is only on Medicare Part B for all 12 months, her marginal tax rate would spike by approximately 79,102% by merely exceeding the income threshold. Similarly, at approximately $95,460 of non-Social-Security income, the 2023 MAGImed would exceed the second MAGImed threshold of $123,000 and the marginal tax rate would spike to 118,704%. For simplicity, we did not include the other three IRMAA-induced spikes in marginal tax rates in Table 1. However, these other spikes in marginal tax rates also need to be considered when retirees select their withdrawal strategy.
Table 1 illustrates the substantial difference between tax brackets and marginal tax rates for typical retired households. In Table 1, although the 2023 tax brackets rise smoothy for this retired single taxpayer who has begun Social Security benefits and will be on Medicare two years hence, her marginal tax rate rises to 150% of her tax bracket and then to 185% of her tax bracket for a wide range of income before falling sharply back to her tax bracket at the income level where 85% of Social Security benefits are taxable. Furthermore, due to IRMAAs, as income continues to rise, there would be up to five huge spikes in the marginal tax rate. The key lesson is that marginal tax rates for most retired households with at least moderate income are substantially different than their stated tax brackets.
Feature

Financial Planning


JOSEPH M from OK posted over 3 years ago:
FREDRIC A from VA posted over 3 years ago:
GREG B from IL posted over 3 years ago:
VICTOR S from NC posted over 3 years ago:
THEODIS P from NC posted over 3 years ago:
DAVE G from TX posted over 3 years ago:
DAVE G from TX posted over 3 years ago:
DAVE G from TX posted over 3 years ago:
JAMES M from MT posted over 3 years ago:
PETER W from TX posted almost 2 years ago:
You need to log in as a registered AAII user before commenting.
Log InCreate an account