

Bonds Have a Role Even With Current Interest Rates
by Charles Rotblut | July 02, 2020
Typically, we look at historical data to provide a gauge with which we can set our expectations for future returns. The current yield environment throws a proverbial wrench into the works when it comes to bonds.
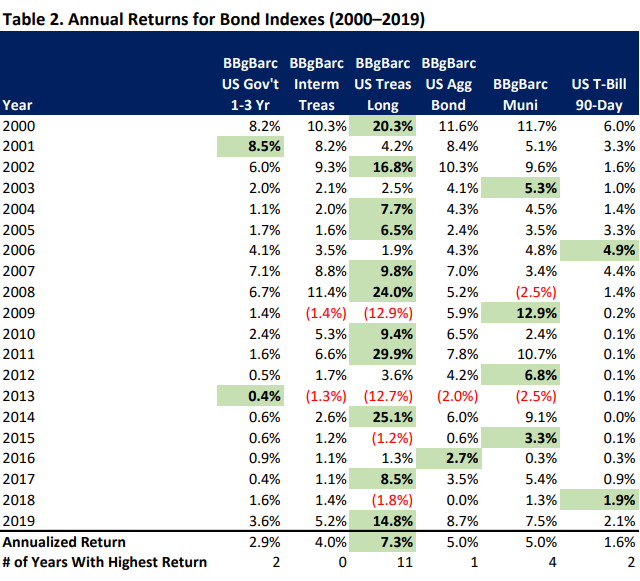
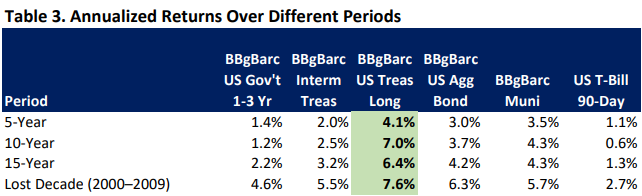
Consider long-term Treasuries. They have been among the best-performing investment-grade bonds over the past 20 years. Even when subset periods are examined, like the last five, 10 or 15 years, long-term Treasuries come out on top. Falling interest rates are the reason why. Bond prices and interest rates are inversely related.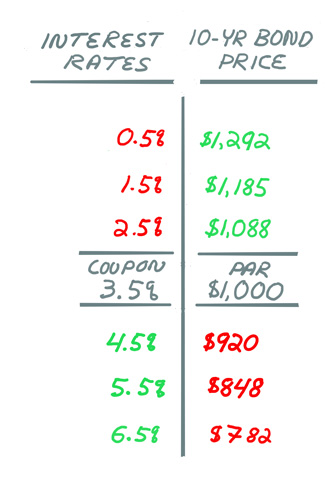
Bond prices adjust to reflect the change in the value of the future cash flows (interest or “coupon” payments) caused by interest rate movements. This is why long-term bonds have done so well over the last 20 years and why some may fear holding them going forward. Falling interest rates increase the appeal of payments tied to a higher coupon rate; rising interest rates have the opposite effect. The relationship is asymmetrical and convex, as you will see in the first table displayed at the end of this week’s commentary.
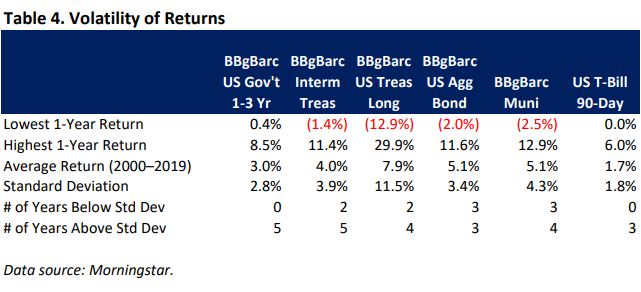
While it is improbable for bonds to experience the same level of returns over the next 20 years as they have over the past 20 years—yields would have to go very negative, which would create a whole different set of problems—there is still an argument for holding bonds in a portfolio. High-quality bonds (Treasuries, investment-grade corporate bonds and investment-grade municipal bonds) are largely uncorrelated to equities. They are also less volatile. These characteristics make bonds a good diversifying agent. Including them in your portfolio will dampen the overall volatility of portfolio returns. As the old adage goes, “bonds can give you the courage to invest in stocks.”
In addition, bonds provide cash flow and—when held to maturity—preservation of wealth. Traditional U.S. bonds pay income twice a year. These are fixed payments you can count on as long as the issuer does not default. Buying individual bonds gives you a certain return if you hold them to maturity. (While gold is also uncorrelated to stocks, it neither provides cash flow nor does it provide any certainty of return.)
What if you buy a traditional bond mutual fund/exchange-traded fund (ETF) instead of individual bonds? You won’t get the certainty of returns since the fund will be managed as a portfolio designed to exist into perpetuity. You will get income and diversification against your equity holdings, as well as exposure to a larger number of bonds than you would be able to achieve yourself. Plus, as interest rates rise, so should the fund’s yield.
Not all bonds are the same though. Here is an overview of the bond categories.
Treasuries are issued by the U.S. government. They are the safest of all bonds since the U.S. government has never defaulted. As such, they also come with the lowest yields. Their maturities range from 90 days for bills to 30 years for bonds. You can buy them directly from the government through the Treasury Direct website.
Corporate bonds are, as the name implies, issued by corporations and commercial enterprises. Their risk varies by issuer. Some are very safe—such as those issued by Apple Inc. (AAPL)—while others are extremely risky—such as those issued by Hertz Global Holdings Inc. (HTZ) or JC Penny Co. (JCP). In general, you’ll want to give preference to bonds whose ratings are in the “A” range or are Baa/BBB. While below-investment-grade bonds offer higher yields, they also come with a greater risk of default. Plus, high-yield bonds offer less diversification benefits relative to stocks than their investment grade peers do. Always be sure to do your own research before buying individual corporate bonds.
Municipal bonds (aka, “munis”) are issued by state, county and local governments as well as similar entities (e.g., a water district). A big appeal of muni bonds is their favorable tax treatment. Interest from muni bonds is generally exempt from federal income taxes and may also be from state and local taxes. This characteristic makes it worthwhile to consider the tax equivalent yield. The tax equivalent yield is the bond’s yield divided by one minus your marginal tax rate. This calculation will show how much yield you will realize once the tax savings are factored in. While defaults among muni bonds are less than they are for corporate bonds, you still want to do your research before buying an individual bond.
We will provide ideas for bond allocations when we update our asset allocation models as part of The AAII Way. The tables below show how interest rate changes can impact bond prices and historical returns for different types of bonds.


-
Determining Bond Price Volatility – This Computerized Investing article has a downloadable spreadsheet for calculating bond price changes.
-
A Fresh Look at Defined-Maturity Bond Funds – These hybrid funds give investors access to professionally managed portfolios and mature on a specified date.
Optimism among individual investors about the short-term direction of the stock market is at a nine-month low. The latest AAII Sentiment Survey also shows the percentage of investors describing their outlook as “neutral” being at a five-month high.
Bullish sentiment, expectations that stock prices will rise over the next six months, declined 2.0 percentage points to 22.2%. Optimism was last lower on October 9, 2019 (20.3%). Bullish sentiment is below its historical average of 38.0% for the 17th consecutive week and the 22nd week this year.
Neutral sentiment, expectations that stock prices will stay essentially unchanged over the next six months, rose 5.0 percentage points to 32.0%. This is the first time since February 12, 2020, that neutral sentiment is above its historical average of 31.5%.
Bearish sentiment, expectations that stock prices will fall over the next six months, fell 3.0 percentage points to 45.9%. Pessimism remains above its historical average of 30.5% for the 19th consecutive week and the 21st time this year.
This week’s bullish sentiment reading is tied for the 83rd lowest level recorded by our survey out of more than 1,700 weekly results. While optimism remains at an unusually low level, pessimism is at an unusually high level. Historically, both have generally been followed by above-average and above-median returns for the S&P 500 index, though the link is stronger for unusually low bullish sentiment than it is for unusually high bearish sentiment.
The current level of pessimism reflects concerns about the coronavirus pandemic and the economy. However, some AAII members have been encouraged by the rebound in the stock market from its March lows. Other factors influencing AAII members’ sentiment include the economy, corporate earnings, the November U.S. presidential election and interest rates.
This week’s special question asked AAII members how their portfolio has performed during the first half of 2020 relative to their expectations at the start of the year. More than half of respondents (56%) say that their portfolio performed worse than expected. This compares to 13% of respondents who say that their portfolio performed better than expected. Additionally, 31% of respondents say that their portfolio performance for the first half of 2020 was more or less as expected.
Here is a sampling of the responses:
- “Considerably worse overall than expected due to sectors negatively impacted by the coronavirus travel restrictions and business closures. Some select businesses in e-commerce and technology have done well, but not enough to overcome the losses in industrial, consumer cyclical and energy stocks.”
- “Expected to perform in line with major indexes. I have exceeded that expectation by starting the year with a 25% cash position and adding to equities during the March sell-off. Accumulating cash again now through income and dividends. Always watching for more investment bargains. Personal travel and entertainment expenses have dropped to zero. Taxes continue to increase.”
- “It has performed satisfactorily, pretty much currently close to its value at the start of the year. It has followed the market—down in March like everything else and recovered in line with the market. Personally, I wish it had stayed down longer so I would have had a chance to invest in bargain prices.”
- “Slightly lower than the start. However, I picked up some value stocks at great prices recently, so I expect good performance going forward as the economy comes out of this artificial recession.”

Bullish: 22.2%, down 2.0 points
Neutral: 32.0%, up 5.0 points
Bearish: 45.9%, down 3.0 points
Bullish: 38.5%
Neutral: 31.0%
Bearish: 30.5%
AAII Asset Allocation Survey
Individual investors’ exposure to equities reached a four-month high in June according to the latest AAII Asset Allocation Survey. Fixed-income allocations, meanwhile, declined to an eight-month low.
Stock and stock fund allocations increased by 2.4 percentage points to 63.2%. Equity allocations were last higher in February 2020 (66.1%). The historical average is 61.0%.
Bond and bond fund allocations pulled back by 0.9 percentage points to 18.3%. Fixed-income allocations were last at this level in October 2019. Even with the decrease, bond and bond fund allocations are above their historical average of 16.0% for the 16th consecutive month and the 17th time in 18 months.
Cash allocations declined 1.6 percentage points to 18.4%. This is the first time cash allocations have been below 20% since February 2020 (14.8%). The historical average is 23.0%.
The increase in equity allocations comes as the stock market experienced its best quarterly performance since 1998. Despite the ongoing rebound, optimism among individual investors about the short-term direction of stocks remained below average throughout June in our weekly sentiment survey.
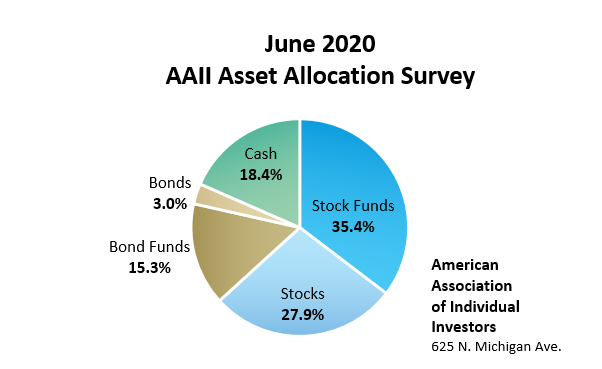
June AAII Asset Allocation Survey results:
- Stocks and Stock Funds: 63.2%, up 2.4 percentage points
- Bonds and Bond Funds: 18.3%, down 0.9 percentage points
- Cash: 18.4%, down 1.6 percentage points
June AAII Asset Allocation Survey details:
- Stocks: 27.9%, up 1.7 percentage points
- Stock Funds: 35.4%, up 0.7 percentage points
- Bond Funds: 15.3%, down 0.3 percentage points
- Bonds: 3.0%, down 0.6 percentage points
Historical Averages:
- Stocks/Stock Funds: 61.0%
- Bonds/Bond Funds: 16.0%
- Cash: 23.0%
The numbers are rounded and may not add up to 100%.
The AAII Asset Allocation Survey has been conducted monthly since November 1987 and asks AAII members what percentage of their portfolios are allocated to stocks, stock funds, bonds, bond funds and cash. The survey and its results are available online at: www.aaii.com/investor-surveys.
- Stocks and Stock Funds: 63.2%, up 2.5 percentage points
- Bonds and Bond Funds: 18.3%, down 0.9 percentage points
- Cash: 18.4%, down 1.5 percentage points
- Stocks: 27.9%, up 1.7 percentage points
- Stocks Funds: 35.4%, up 0.7 percentage points
- Bonds: 3.0%, down 0.6 percentage points
- Bond Funds: 15.3%, down 0.3 percentage points
- Stocks/Stock Funds: 62.0%
- Bonds/Bond Funds: 16.0%
- Cash: 22.0%
Take the Asset Allocation Survey.
June 25, 2020 Comparing the Five Major Categories of Stocks
June 18, 2020 How Much Could You Gain or Lose in One Year?
June 11, 2020 Responding to Member Feedback About Assessing Risk Tolerance
June 4, 2020 Two Key Factors Influencing Your Risk Tolerance

Discussion
Ed Shoben from Arizona posted over 6 years ago:
Table 1 has, I believe a problem. If rates increase, then bond prices drop. The more rates go up, the more bond prices drop. Table 1 shows this pattern. However, if rates decrease then bond prices go up. The more rates decrease, the more bond prices should rise. Yet, in Table 1, for a 10 year maturity, prices rise by 29% if rates drop 1 per cent, by only 19% if rates drop 2 per cent, and by 29% if rates drop 3 per cent. To my thinking, such an outcome makes no sense.
Shree N from NJ posted over 6 years ago:
I find it hard to be convinced that bonds have a meaningful role in a portfolio at the current interest rates. In times of stress we have seen negative correlation to equities vanish as it happened in March this year or during the 2007-08 financial crisis. As for holding bonds to maturity as a means to wealth preservation, the author does not address the inflation risk which could lead to wealth erosion due to negative real yield. In my humble opinion, a secular bear market in bonds is probably under way. Gold seems to be a better hedge.
Dan from PA posted over 6 years ago:
Ed - You are correct. What happened is that all the values shown in the 3% Rate Decrease column were erroneously entered into the 1% Rate Decrease column. This error is present not only for the 10-year maturity that you cited, but for all the listed maturities.
vic smyth from Illinois posted over 6 years ago:
Table 1 has some errors in it. The 1% decrease has the same percentage amounts as the 3% decrease. Just eyeballing the table other values do not look correct either. If interest rates are 3.5% and decrease by 1% to 2.5% a 1-year bond will not go up 3% in value, a 30-year bond will not go up 83% in value. Please proofread your chart and re-post it.
Nancy from MD posted over 6 years ago:
I believe the increase in value for 10-year bond when rates fall by 1% is posted incorrectly. It is too high. May want to post a correct schedule.
Charles M Rotblut from Illinois posted over 6 years ago:
We've fixed Table 1. Sorry for the error. The rates decrease 1% was pulling data from the wrong column and we'd didn't catch the error before publication. -Charles
Hugh from OR posted over 6 years ago:
What does "BBgBarc" refer to in the tables at the end of the article?
You need to log in as a registered AAII user before commenting.
Create an account