 DHI
DHI
Last week I presented a webinar on how to use AAII’s My Portfolio tool. You can view a replay of it by clicking here.
In that webinar I discussed the weekly Portfolio Insights email that is part of your A+ Investor subscription.
We received several comments from subscribers stating that they do not receive the Insights email.
To receive the weekly Portfolio Insights email, you will need to create at least one portfolio using the My Portfolio tool that also contains at least one stock, mutual fund or exchange-traded fund (ETF) ticker. If you haven’t done so, you can use these instructions to create your first portfolio.
Each week, the Portfolio Insights email offers a combined snapshot of all the portfolios you have set up in My Portfolio. The email highlights strong and weak stock, mutual fund and ETF performers in your portfolios. It also reports on stocks that had been added to or fallen off of the passing company lists of any AAII stock screening strategies you track.
For stock investors, the Portfolio Insights email highlights:
For mutual fund and ETF investors, the Insights email provides information on:
The My Holdings at a Glance section at the top of the email shows you those stocks you track in any of your portfolios that have seen two or more upgrades or downgrades to any of their A+ Stock Grades compared to where they were at the end of the previous week. Clicking the View All link will take you to a table with all of the stocks you track along with their current A+ Stock Grades.
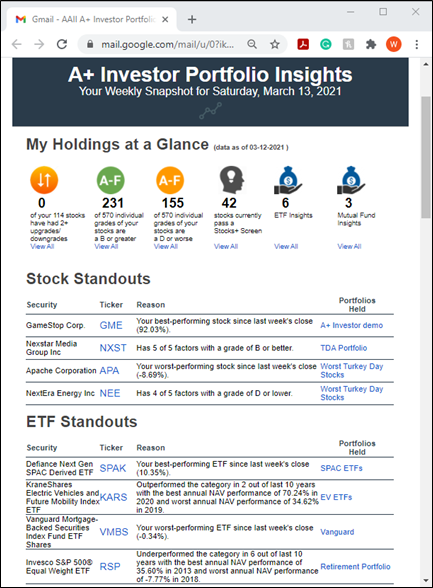
The Insights email also tells you how many of the individual Stock Grades for Value, Growth, Momentum, EPS Revisions or Quality for the stocks you track are B or better or D or worse. In this example, there are 114 stocks in all the portfolios this user created, meaning there are 570 total grades (114 × 5 = 570). Two hundred thirty-one (40.5%) of the Stock Grades for the 570 grades tracked are B or better, while 155 (27.2%) are D or worse.
The Insights email identifies any stocks that you track in a portfolio that meet the criteria of any of AAII’s stock screening strategies. Also, if you have favorited any of AAII’s stock screening strategies, the My Stock Strategies section of the Insights email lists stocks that have been added to or dropped off from the passing company lists of those favorited screens since the end of last week.
As part of the My Holdings at a Glance section of the Portfolio Insights email, you can see how many stocks that you track with My Portfolio pass any of the 60+ screening strategies AAII follows:
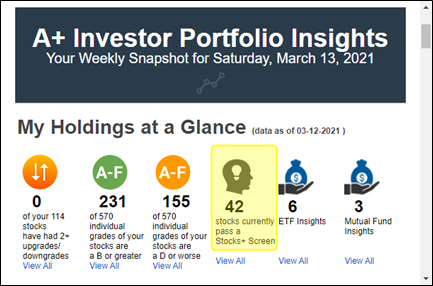
In this example, 42 of the stocks tracked in any of the portfolios this user has created using My Portfolio pass one or more of the AAII stock screening strategies.
Clicking on the View All link for this statistic takes you to a new table we have created within My Screens that lists the stocks you track that pass at least one of AAII’s stock screens:
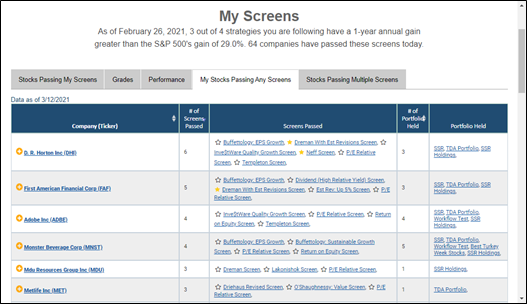
This table is updated daily through the close of the previous trading day and is fully sortable. (You can also access the My Stocks Passing Any Screens list through the My Screens link in the Screening area of AAII.com.)
The table shows the relevant stocks you track, which links to their Stock Evaluator page for further analysis. The table also reports how many different AAII screens each stock passes and the names of those screens linked to more about the strategy. Lastly, you can see how many of your portfolios the stock is held in and the linked names of those portfolios.
In this example, D.R. Horton Inc. (DHI) passes six AAII stock screens as of the close on March 12, 2021:
Clicking on any of the screening strategy names will take you to that strategy where you can see its long-term performance, current list of passing companies and a detailed description of the strategy.
The My Holdings at a Glance section also indicates if any of the mutual funds or ETFs you track stand out in terms of performance, volatility or expenses. Clicking the View All links for these two items will show you the Fund/ETF Insights for those mutual funds or ETFs held in your “favorite” portfolio:
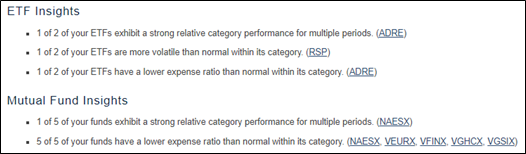
In those instances where a mutual fund or ETF is lagging its category based on long-term performance, has expenses that are higher than the typical fund in its category or is more volatile than the typical fund in its category, you may wish to dig deeper into the fund and compare it to alternatives to see whether a change is warranted.
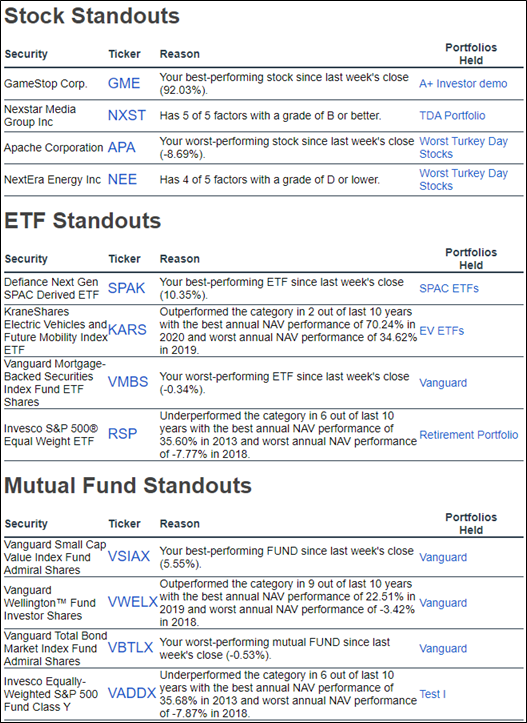
Farther down the Portfolio Insights email, the Stock, ETF and Mutual Fund Standouts sections highlight individual tickers you track in your portfolios. For stocks, you see the best- and worst-performing stock since the close of the previous week as well as the stock that is the best- and worst-rated among all those you track.
For ETFs and mutual funds, you also see tickers that have been the strongest and weakest performers over the last week, and funds and ETFs that have the strongest and weakest performance relative to their category averages over the last 10 years.
The My Stock Strategies section of the email lists stocks that are new to the passing company lists of any AAII screening strategies you have favorited compared to the close of the previous week:
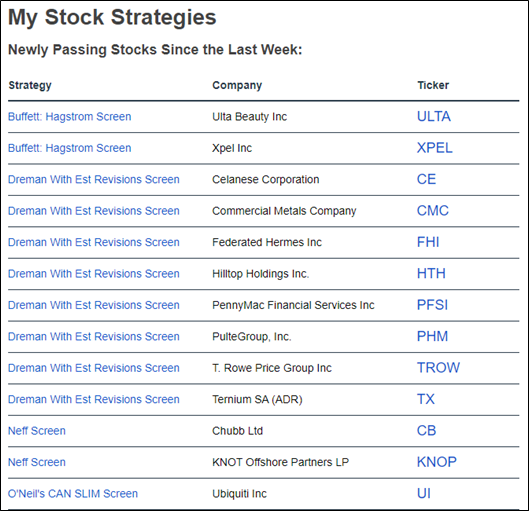
Clicking on the tickers of any of these stocks will take you to their respective Stock Evaluator page, and from there you can add them to a current or new portfolio to track them going forward.
Finally, the Portfolio Comparison section of the Portfolio Insights email shows you the asset allocation of all of the portfolios you have created with My Portfolio and then compares your allocation to the average allocation of all AAII members (A+ Investor asset allocation) as well as to the three AAII asset allocation models:
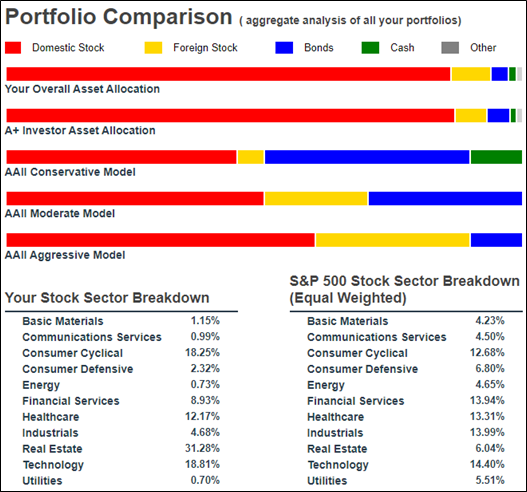
This section also computes the sector breakdown of all the individual stocks and equity mutual funds and ETFs you have in your portfolios and compares it to that of the equal-weighted S&P 500 index.
The email concludes with a Did You Know? section, where you can find useful “hacks” that help you get the most out of your A+ Investor subscription.
We designed My Portfolio to be more than just a tool for monitoring the price changes of your investments. We included features designed to help you make better decisions. My Portfolio’s analytical tools will help you identify whether you are taking on too little or too much risk as well as whether you have too much or too little exposure to certain types of investments. You can use this information to determine whether you need to adjust your allocations or are on the right path. The Portfolio Insights email is meant to be an extension of My Portfolio, providing a weekly overview of your portfolio(s) to help you monitor your holdings and make informed portfolio decisions.

