Understanding how earnings surprises and earnings estimate revisions influence stock prices can be a critical edge for investors. Companies that outperform analyst expectations often see significant price gains, while those that miss expectations tend to suffer. The effects of these surprises can linger far longer than most realize, impacting stock performance for months. By leveraging tools like the A+ Stock Grades Screener, investors can identify companies poised for success based on their earnings surprises and estimate revisions. This installment of Making the Grade delves into how you can harness the power of these metrics, exploring the nuances of earnings estimate revisions and how they correlate with market performance, ultimately guiding you toward more informed investing decisions.
Stock prices of firms that significantly exceed analyst expectations (positive earnings surprises) tend to outperform the market, while those with negative surprises tend to underperform.
The impact of the earnings surprise is longer-lasting than most would think. The most significant effect of the surprise can be seen immediately, but the impact of the surprise may be felt for as long as a year. The effect tends to last longer for negative earnings surprises. It simply takes time for the market to recognize that a fundamental shift is occurring. It does not generally make sense to be a bargain hunter and buy a stock after the initial price decline on a negative earnings surprise. There is a good chance the stock will continue to underperform the market for some time. Separately, it may not be too late to buy into an attractive stock after a better-than-expected earnings report is released, provided the fundamentals are still valid.
Not surprisingly, large firms tend to adjust to surprises faster than small firms. Larger firms are followed by more investors, analysts and portfolio managers who act on the information more quickly and more thoroughly.
Changes in estimates reflect analyst expectations of future performance changes and lead to price adjustments similar to earnings surprises. When earnings estimates are revised significantly upward—5% or more—stocks tend to show above-average performance. Conversely, stock prices of firms with downward revisions show below-market performance.
Changes in analyst estimates are more meaningful when individual estimates move away from the average rather than toward the consensus.
According to FactSet, as of August 12, 2024, 91% of the companies in the S&P 500 index reported earnings for the second quarter of 2024 that ran from April 1 through the end of June. Of these companies, 78% have reported actual earnings per share above their respective mean estimates, above the five-year average of 77%. In aggregate, earnings have exceeded estimates by 3.5%, below the five-year average of 8.6%.
However, FactSet’s research shows that companies that have reported positive earnings surprises have seen an average price increase of 0.8% two days before and after the earnings release. This percentage increase is below the five-year average price increase of 1.0% for companies reporting positive earnings surprises during this same window. Companies that have reported negative earnings surprises have seen an average price decrease of 3.8% two days before and after the earnings release. This percentage decrease is larger than the five-year average price decrease of 2.3% for companies reporting negative earnings surprises during this same window.
Expectations play a crucial role in price activity, especially in the short term, as to changes in those expectations. As companies change their outlooks, investors change their expectations, which can also lead to price adjustments.
Looking at earnings guidance, the percentage of S&P 500 companies that have issued negative earnings guidance for the third quarter of 2024 is below average. At this point, 86 S&P 500 companies have issued earnings guidance for third-quarter 2024. Of these 86 companies, 47 have negative earnings guidance, and 39 have positive earnings guidance. The percentage of companies issuing negative earnings guidance for the third quarter of 2024 is 55% (47 out of 86), below the five-year average of 59% and the 10-year average of 63%.
Regarding revisions to earnings estimates for S&P 500 companies, analysts lowered earnings estimates for the third quarter of 2024 at average levels during July. The third-quarter 2024 bottom-up earnings estimate (an aggregation of the median third-quarter earnings estimates for all the companies in the S&P 500) decreased by 1.8% (from $63.20 to $62.08 per share) from June 30 to July 31. This decline was equal to the five-, 10- and 20-year average for the first month of a quarter.
Out of the 6,692 U.S.-listed stocks in the AAII stock database as of August 16, 4,123 have at least one analyst providing an estimate for their current fiscal quarter. Of those, 3,653 companies have reported quarterly results since the beginning of July. More than 62% (62.3%) reported a positive earnings surprise, but only 41.5% (1,516 companies) reported earnings that exceeded the mean estimate by at least one standard deviation—a standardized unexpected earnings (SUE) score of at least 1.0. The SUE score is a metric investors use to gauge how much a company’s actual earnings deviate from what analysts were expecting. A high positive SUE score suggests that the company significantly missed expectations, which could be a positive signal for investors. In other terms, the higher the SUE score, the more statistically significant the surprise. We talk about the SUE score more a little later.
By comparison, nearly 38% (1,236) of companies that have reported fell short of their consensus earnings estimate, with 53% (656) missing their estimate by more than one standard deviation.
Out of the 4,123 companies reporting since the beginning of July, only 1,397 (33.9%) have seen analysts boost their mean estimates for the current fiscal quarter over the past month, with 19.2% seeing a 5% or more increase.
A+ Investor subscribers have exclusive access to A+ Stock Grades for more than 6,500 stocks for value, growth, momentum, quality and earnings estimate revisions. The Earnings Estimate Revisions Grade ranks companies by the statistical strength of their two latest quarterly earnings surprises and earnings revisions for the current fiscal year over the last month and three months.
Earnings estimates are a critical element to consider as investors look for stock ideas and manage their holdings.
Using the A+ Stock Grades Screener, you can isolate those companies that grade highly based on earnings estimates revisions (along with growth, value, momentum and quality).
Now that we are nearing the end of the earnings reporting season, we can identify companies that have reported strong (or weak) earnings surprises and those seeing their consensus estimates revised (upward or downward).
The A+ Stock Grades Screener allows you to filter for stocks with specific factor grades. As of the close on Friday, August 16, 2024, there were 280 (4.2%) stocks out of the universe of 6,690 companies with an Earnings Estimate Revisions Grade of A.
However, this is still a large universe of companies to sift through. To narrow the universe even further, I first applied a filter of an A grade for quality. Currently, 1,120 companies in the A+ Investor universe have a Quality Grade of A, while 55 have A grades for both earnings estimate revisions and quality.
Research from David Dreman and others shows that deep-value companies respond more favorably to significant positive earnings surprises and react less adversely to negative ones. Therefore, the next filter I applied looked for a Value Grade of A. There were 982 companies with a Value Grade of A, and adding it to the other filters lowered the number of passing companies to 10.
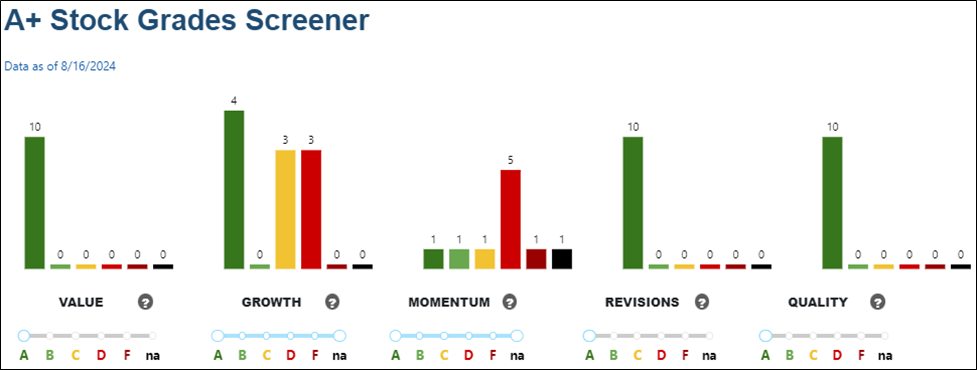
The 10 passing companies are ranked from the highest Earnings Estimate Revisions Score to the lowest.
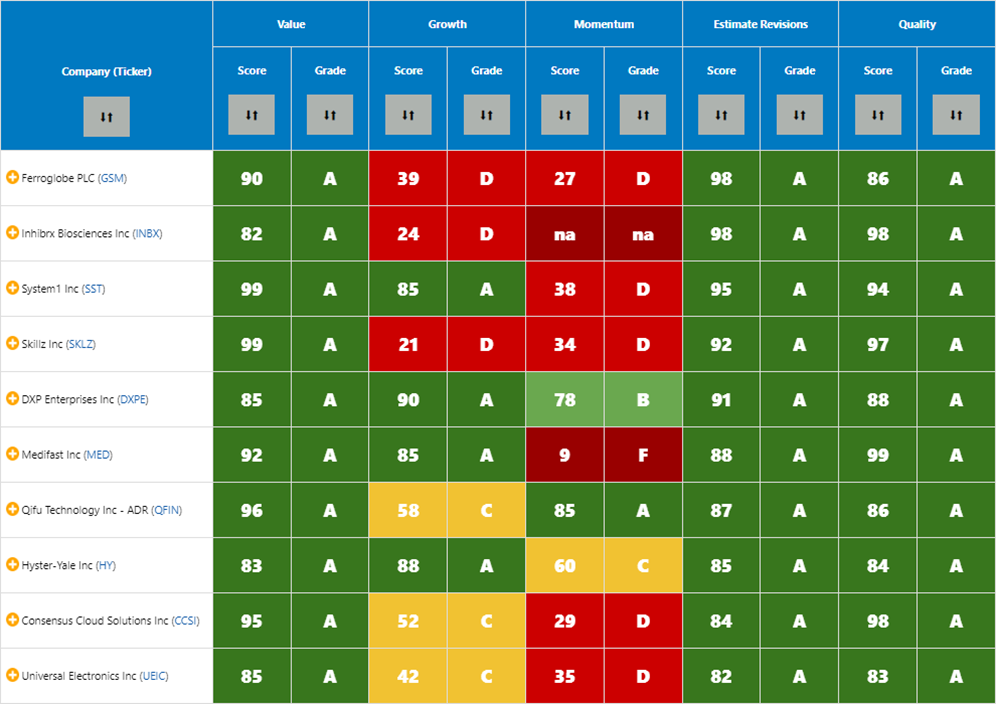
Ferroglobe PLC  (GSM) and Inhibrx Biosciences Inc. (INBX) have the highest Earnings Estimate Revisions Score of 98. System1 Inc. (SST) had the second-highest Earnings Estimate Revisions Score among the final 10 companies at 94.
Clicking on the ticker for Ferroglobe takes us to its Stock Evaluator page. From there, clicking the Grades tab gives us a detailed explanation of the five individual factor grades. For this example, we focus on Ferroglobe’s Earnings Estimate Revisions Grade:
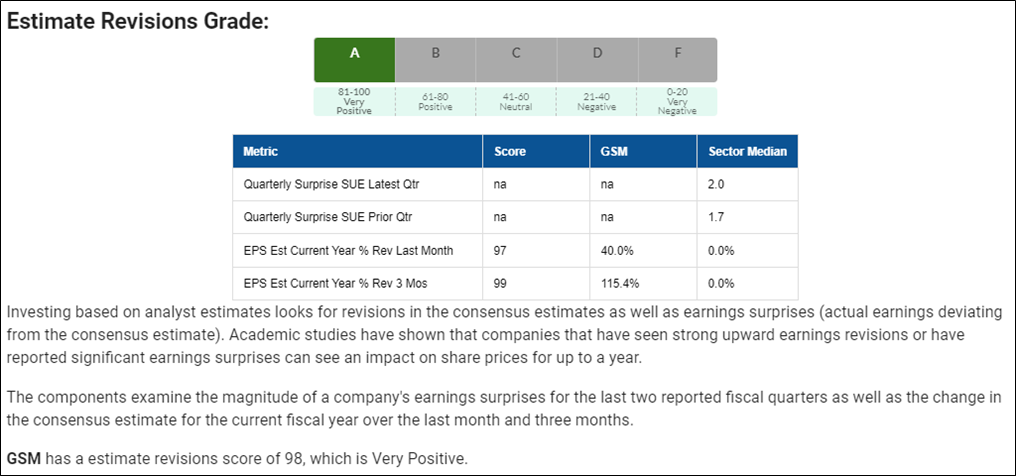
Ferroglobe has an overall Earnings Estimate Revisions Score of 98, which is very positive and translates into an Earnings Estimate Revisions Grade of A. This grade is arrived at by using four different pieces of data:
A company’s Earnings Estimate Revisions Grade is based on one to four of these elements. A company must have valid, non-null values for at least one of these elements to receive a grade.
To say that a company missed or exceeded its quarterly consensus earnings estimate does not necessarily capture the real significance of such an event. An earnings surprise is considered more significant the farther it is outside the statistical range of estimates expected at the time of the announcement. Assuming a normal distribution of earnings estimates, 68.2% of actual earnings will be within one standard deviation of the consensus estimate, 95.4% within two standard deviations and 99.7% within three standard deviations. The absolute value of the SUE score measures the degree of unexpected earnings. There is no earnings surprise when the SUE score equals zero; the actual earnings per share are in line with the consensus earnings estimate.
The standard deviation of Ferroglobe’s estimates for its second quarter ended June 30, 2024, was $0.00. The two analysts tracking the company and polled by LSEG I/B/E/S were expecting earnings of $0.05 per share. Still, the company ended up reporting earnings of $0.13 per share. Dividing the difference between the estimates and actual earnings ($0.13 – $0.05) by the standard deviation of the estimates ($0.00) resulted in a null value since you cannot divide zero into a number. The same was true for the SUE score for the first quarter ended March 31, 2024.
The consensus earnings estimate for Ferroglobe’s current fiscal year ending December 2024 stood at $0.28 per share as of August 16. One month ago, analysts forecasted full-year 2024 earnings to be $0.20 per share. The company reported second-quarter 2024 earnings on August 5, and the full-year 2024 estimate jumped 40% since then. Three months ago, the estimate for the current fiscal year was $0.13 per share, which translates to a three-month increase of more than 115%.
The “raw” values of the four metrics used for the Earnings Estimate Revisions Grade are then converted to percentile ranks, which compare them against all of the stocks in the universe. Since both are null, Ferroglobe does not receive a score for its SUE scores.
The percentage changes in the current year’s consensus earnings estimate over the last month and three months rank in the 97th and 99th percentiles, respectively. The percentile ranks for the four underlying metrics are then averaged. For Ferroglobe, this translates into an Earnings Estimate Revisions Score of 98, which places it in the A, or “very positive,” grade range.
While investing in companies seeing significant upward earnings estimate revisions has been shown to generate promising results over the long term, it is essential to consider elements of financial strength, quality or price momentum. As an A+ Investor subscriber, you can evaluate the earnings estimate revisions of individual stocks and use the A+ Stock Grades Screener to isolate those companies with high Earnings Estimate Revisions Scores along with elements of growth, momentum, quality and value.
A+ Investor and Platinum subscribers can set up alerts for price activity and changes to A+ Stock Grades. Click here for more information on these alerts.
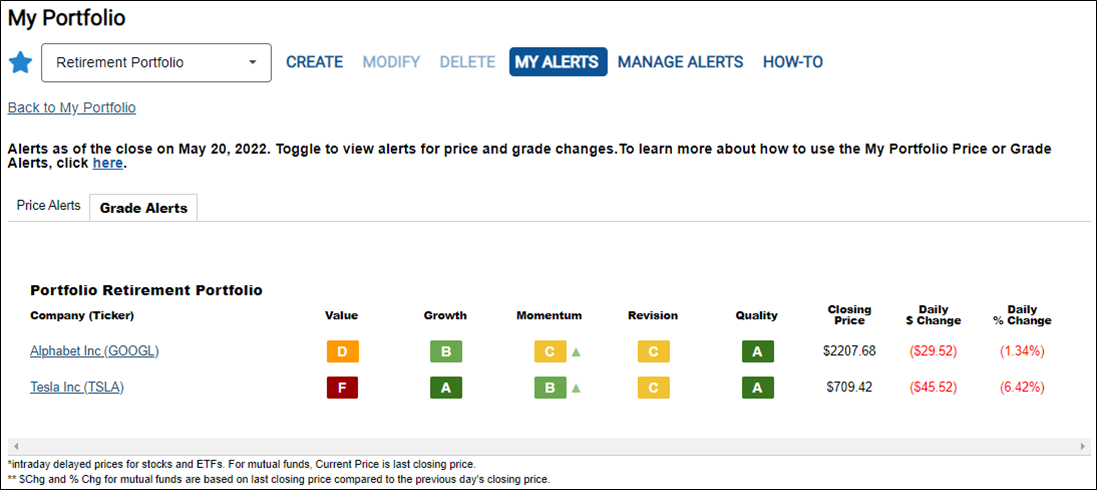
The Grade Alerts tool allows A+ Investor and Platinum subscribers to track daily grade changes for stocks followed in portfolios created with My Portfolio. These grades are only for stocks in the A+ Investor stock universe. There are no grade alerts for mutual funds or exchange-traded funds (ETFs).
The Grade Alerts are triggered if stocks in the portfolio(s) you specify meet the grade-change criteria you set up. Like price alerts, these alerts are posted online in the My Portfolio area of the AAII website by going to the My Alerts section and selecting the Grade Alerts tab. You can also sign up for a daily email that will alert you if any of your stock holdings have grade actions that pass your custom alert rules. My Portfolio grade changes are updated daily around 9:00 a.m. Central Time, Tuesday through Saturday.
For this example, the Grade Alerts can notify you when a company you track sees an upward or downward change in its Earnings Estimate Revisions Grade. Subscribers can define custom grade alert settings for stocks added to My Portfolio by clicking on the My Alerts tab of My Portfolio. The user can define grade changes (up or down) for the five investment factor grades (value, growth, momentum, earnings estimate revisions and quality). For each of these five investment factors, A+ Investor subscribers can select to view grade changes (up or down) for one grade change, two grade changes, three grade changes and four grade changes.
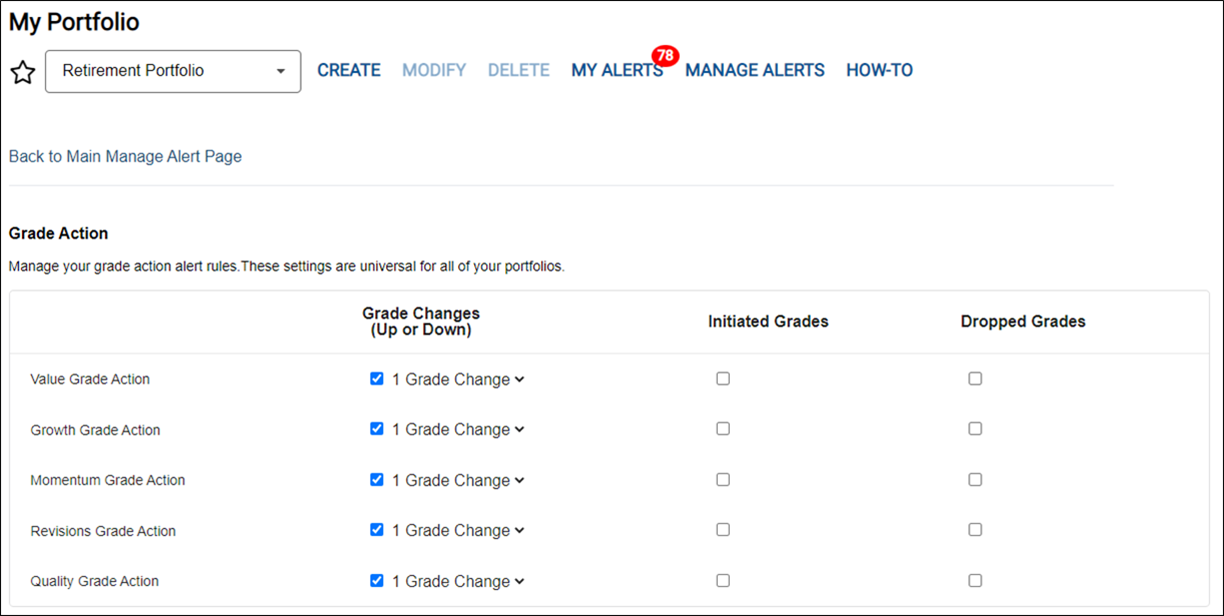
With the selected grade alert settings, you can view a summary of the stocks that meet your grade alert settings by clicking My Alerts at the top of the page and then choosing the Grade Alerts tab. The up or down arrow next to the grade letter shows you the direction of the change in grade.
By understanding the power of earnings surprises and earnings estimate revisions, you can gain a significant edge in your investing strategy. The A+ Stock Grades Screener is a powerful tool that helps you identify stocks poised for success based on these critical factors. As you refine your portfolio, remember to stay informed and proactive. Don’t miss out on the opportunity to enhance your investment decisions—start using the A+ Stock Grades Screener today to uncover potential investment opportunities, and use My Portfolio to stay informed about the activity in your portfolio.

