A+ Stock Grades for individual stocks are ubiquitous across A+ Investor pages. But you may not know that you can also see the aggregate grades for AAII Stock Screens.
The A+ Stock Grades system is a grading tool based on percentile rankings of key metrics within five investment factors: value, growth, momentum, earnings estimate revisions and quality. The grades represent a summary of a company’s fundamentals and give you a quick overview of how a stock rates based on these five investment factors that have been shown to produce market-beating results.
Aggregate stock grades based on the current set of passing companies for each of the AAII Stock Screens are presented at the Stocks area of AAII.com.
To access the complete list of all the stock screens, select AAII Stock Screens from the Stocks drop-down menu on AAII.com.
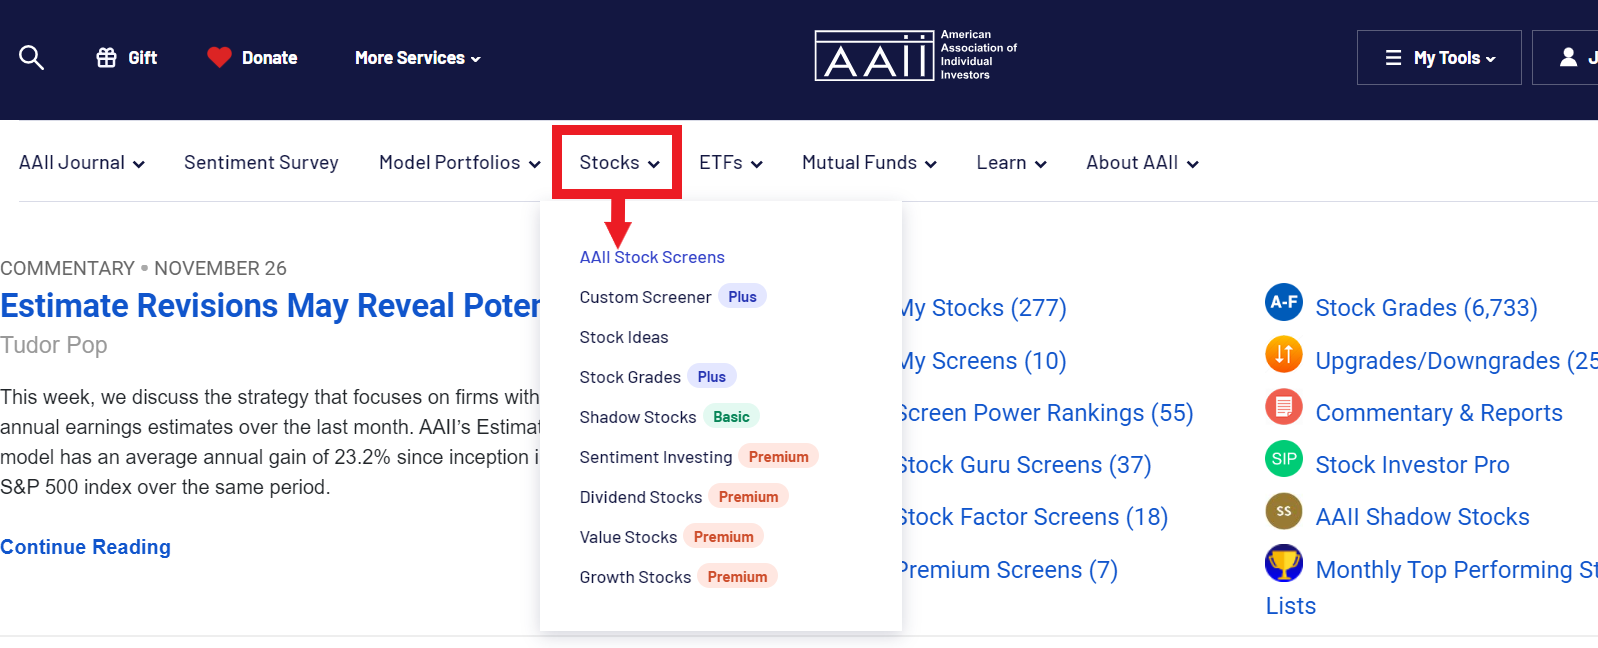
The link will take you to a table listing the 50+ stock screening strategies AAII has developed and tracks.
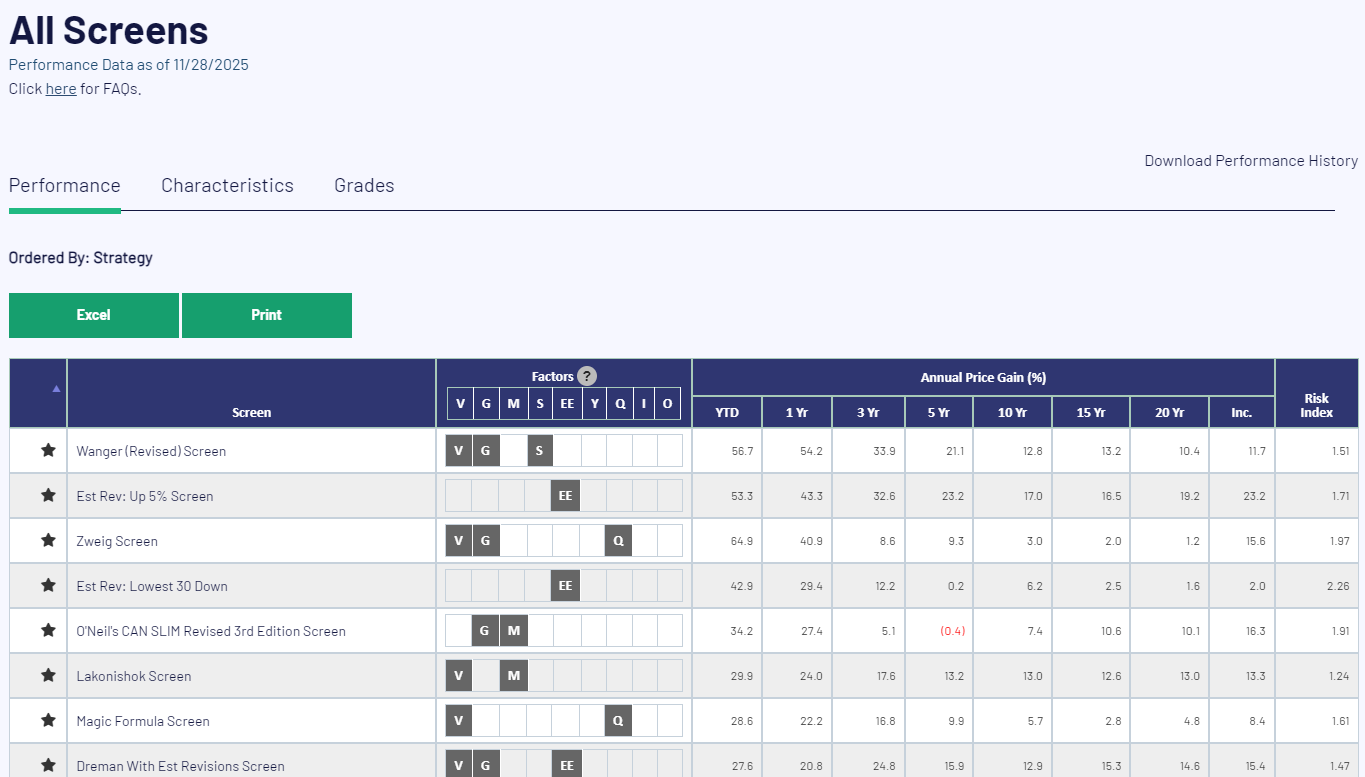
By default, the Performance tab is displayed, showing gains over various periods for all the stock screens AAII tracks. You can sort the table by any of the columns; by default, the list is sorted by one-year price gain.
The Factors columns indicate the underlying characteristics of the various screens. For example, the Revised Wanger screen, which tops the list with a gain of 54.2% over the last year, uses filters identified with value (V) and growth (G) investing and focuses on small companies (S for size). The screen looks for companies with market capitalizations between $100 million and $2 billion. Companies must have a positive annualized growth rate in sales for the last three years, and quarterly sales growth rates over the past year must compare favorably to the median for its industry. In addition, the price-earnings-to-earnings-growth (PEG) ratio must be above 0.2 and below 1.0.
The All Screens table also has a Grades sub-tab.
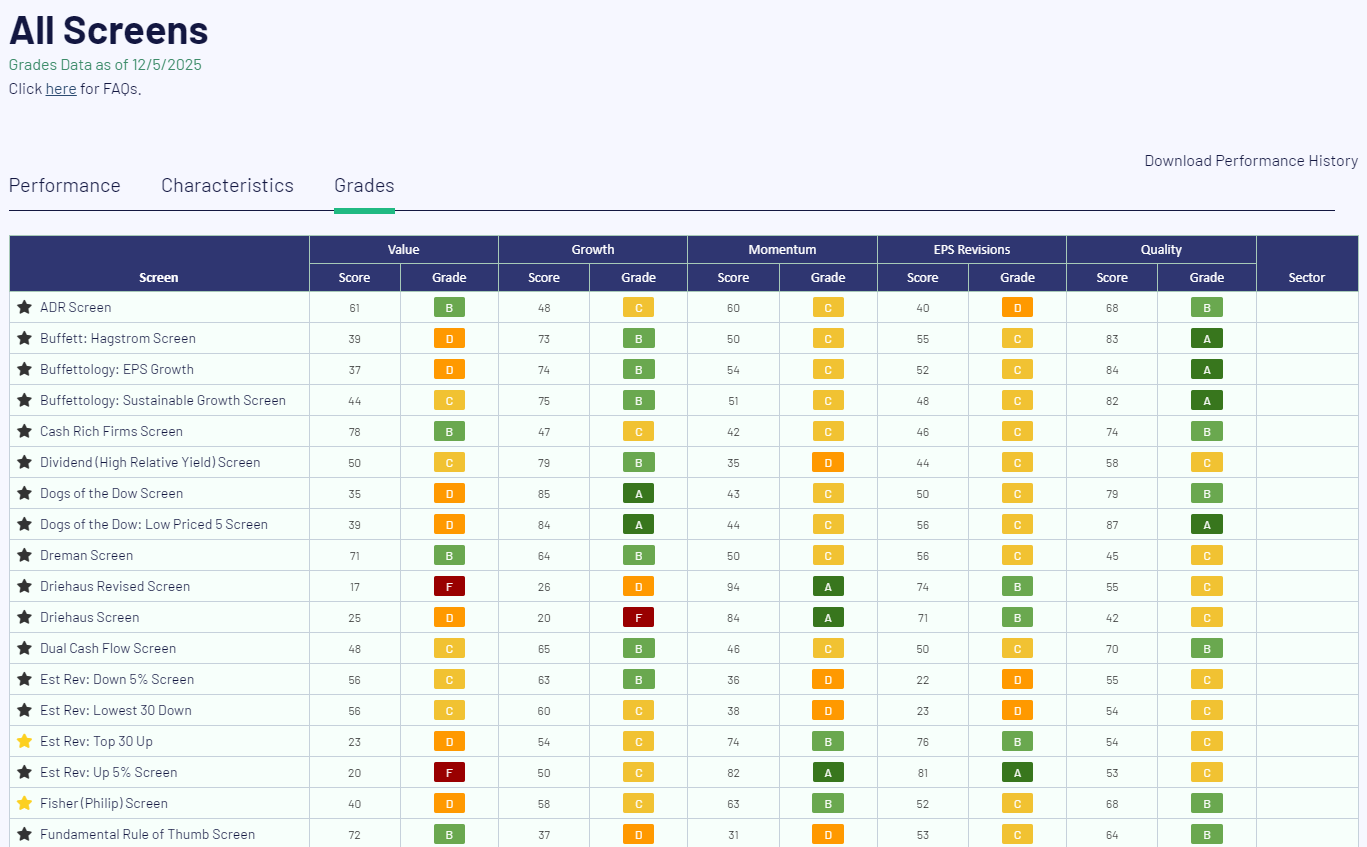
This table shows the average scores and corresponding grades for each AAII stock screen based on the companies that currently meet the screen’s criteria. The passing companies list and average screen grades are updated daily through the previous trading day’s close.
By providing the average A+ Stock Grades for all stock screens, this page offers you a clear picture of the types of stocks that pass each screen based on their factor profiles. This, in turn, will help you decide whether a given strategy fits your own investing philosophy.
If you gravitate more toward value stocks, you may not be interested in stock screens where the average A+ Value Grades are consistently D’s or F’s. Likewise, growth investors may want to look past those screens with low average A+ Growth Grades.
To see the grades for the individual stocks that comprise a screen, go to the A+ Stock Grades Screener, listed as Stock Grades on the Stocks drop-down menu.
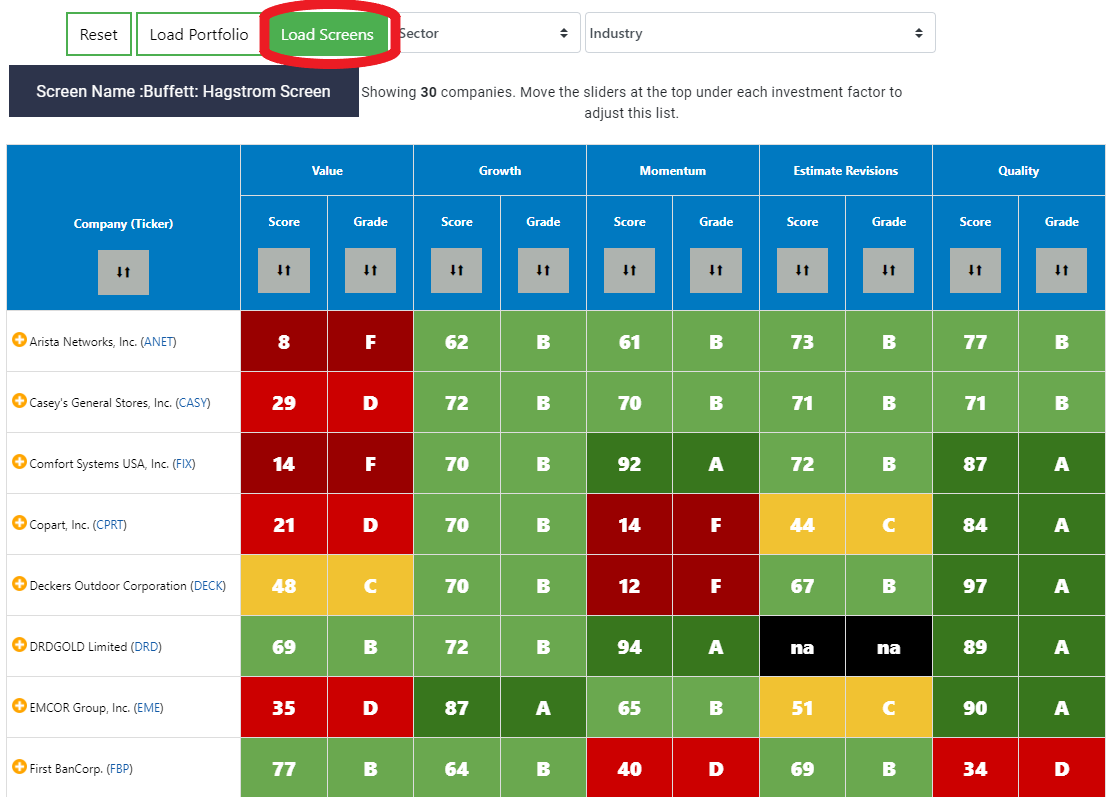
Select the desired screen from the Load Screens list.
At the top of the A+ Stock Grades Screener page, histograms (bar graphs) show the distribution across the letter grades for each of the five A+ ratings.
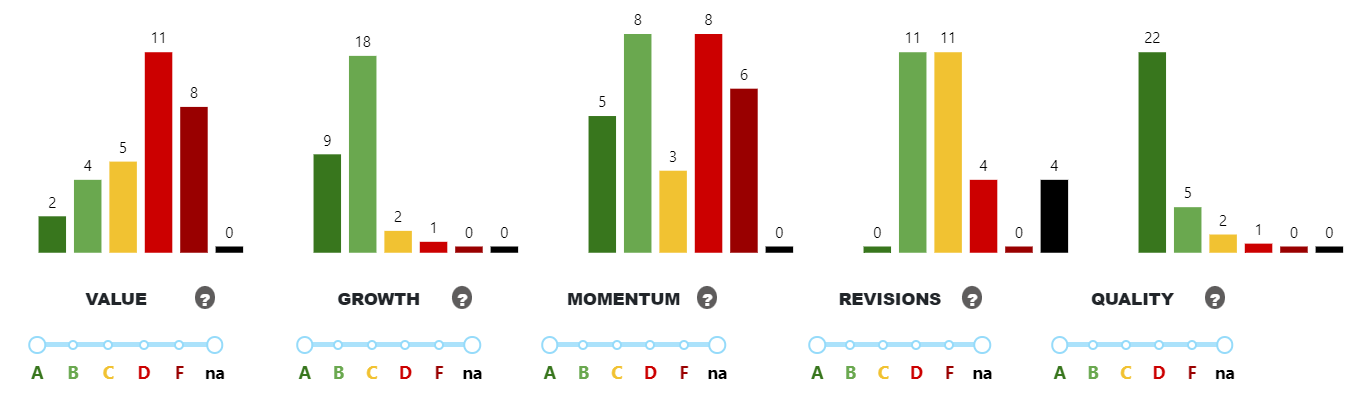
You can adjust these bars to isolate stocks on the list that have a minimum grade for any of the five factors.

