COMPANY SUMMARY
Northern Trust Corporation, a financial holding company, provides wealth management, asset servicing, asset management, and banking solutions for corporations, institutions, families, and individuals. It operates in two segments, Asset Servicing and Wealth Management. The Asset Servicing segment offers asset servicing and related services, including custody, fund administration, investment operations outsourcing, investment management, investment risk and analytics services, employee benefit services, securities lending, foreign exchange, treasury management, brokerage, transition management, banking, and cash management services. It serves corporate and public retirement funds, foundations, endowments, fund managers, insurance companies, sovereign wealth funds, and other institutional investors. The Wealth Management segment offers trust, investment management, custody, and philanthropic services; financial consulting; guardianship and estate administration; family business consulting; family financial education; brokerage; and private and business banking services. This segment also provides global custody, fiduciary services, family office consulting, and technology solutions to high-net-worth individuals and families, business owners, executives, professionals, retirees, and established privately held businesses. In addition, it offers asset management and related services comprising active and passive equity; active and passive fixed income; cash management; multi-asset and alternative asset classes that include private equity and hedge funds of funds; and multi-manager advisory services and products through separately managed accounts, bank common and collective funds, registered investment companies, exchange-traded funds, non-U.S. collective investment funds, and unregistered private investment funds. Further, the company provides overlay and other risk management services. The company was founded in 1889 and is headquartered in Chicago, Illinois.
Financial Summary
| Share Statistics |
NTRS |
Industry
Median |
Percentile
(All Stocks) |
| Market Cap (Mil) |
$30,641.4 |
$2,967.8 |
90% |
|
| Shares Out (Mil) |
184.9 |
83.1 |
74% |
|
| Institutional Ownership |
98.2% |
76.4% |
77% |
|
| Float (Mil) |
179.8 |
73.3 |
72% |
|
| Beta |
1.26 |
0.94 |
74% |
|
| Avg Daily Volume (000s) |
1,132 |
564 |
72% |
|
Price Change
(52-week) |
34.3% |
71.4% |
76% |
|
| Growth |
NTRS |
Industry
Median |
Percentile
(All Stocks) |
| Sales (5yr) |
6.3% |
8.4% |
43% |
|
| Net Income (5yr) |
7.5% |
8.1% |
51% |
|
| EPS (5yr) |
9.9% |
9.0% |
47 |
|
| Dividends (5yr) |
2.1% |
1.4% |
95% |
|
| Cash Flow (5yr) |
83.7% |
0.1% |
98% |
|
| Estimates |
Qtrly |
Current
Fiscal
Year |
Next
Fiscal
Year |
| # of Estimates |
11 |
12 |
13 |
| Current EPS |
$2.853 |
$11.505 |
$12.850 |
| Month Ago EPS |
$2.830 |
$11.425 |
$12.689 |
| # Rev Up |
0 |
0 |
1 |
| # Rev Down |
1 |
0 |
0 |
| Three Months Ago EPS |
$2.768 |
$11.073 |
$12.350 |
| Year/Year Chg |
(32.6%) |
31.6% |
65.3% |
| Financials |
NTRS |
Industry
Median |
Percentile
(All Stocks) |
| Sales (TTM) (Mil) |
$9,086 |
$1,066 |
83% |
|
| Net Income (TTM) (Mil) |
$2,241 |
$87 |
92% |
|
| EPS (TTM) |
$11.681 |
$0.900 |
95% |
|
| Operating Cash Flow (TTM) (Mil) |
$529 |
$56 |
72% |
|
| Net Cash Flow (TTM) (Mil) |
($687) |
$16 |
4% |
|
| Long-Term Debt (Q1) (Mil) |
$5,405 |
$209 |
86% |
|
| Enterprise Value (Q1) (Mil) |
na |
$1,362 |
na |
|
| Valuation |
NTRS |
Industry
Median |
Percentile
(All Stocks) |
| P/B |
2.45 |
2.48 |
61% |
|
| P/E |
14.4 |
19.4 |
37% |
|
| Dividend Yield |
2.1% |
0.9% |
77% |
|
| PEG (5yr hist) |
1.5 |
1.4 |
60% |
|
| Ratios |
NTRS |
Industry
Median |
Percentile
(All Stocks) |
| Gross Margin |
na |
72.1% |
na |
|
| Net Margin |
24.7% |
14.8% |
83% |
|
| ROA |
1.3% |
1.4% |
50% |
|
| ROE |
18.3% |
12.4% |
77% |
|
| Liabilities to Assets |
92.5% |
60.3% |
90% |
|
| F-Score |
5 |
5 |
50% |
|
Passing Stock Screens
As of 10/13/2026, from a list of 60 stock screening strategies,
NTRS meetings the criteria of 1 screen:
Stock Screen
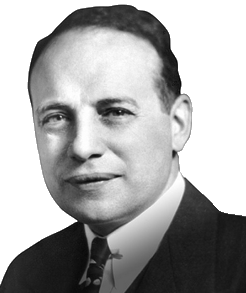
GURU STRATEGY
Graham--Defensive Investor (Utility) Screen
Factors: Yield, Value, Quality, Industry/Sector
Graham's approach leads to three separate screens that focus on the concept of intrinsic value, justified by a firm's financial strength.


