

S&P 500 Stocks With the Potential to Outperform in 2026
by Charles Rotblut | December 11, 2025
Featured Tickers: ALB
BALL
BLDR
CFG
EQT
EXPE
FITB
GEHC
IP
IVZ
KEY
LYB
NRG
PODD
SW
WBD
WDC
WY
ZBRA
ALB
BALL
BLDR
CFG
EQT
EXPE
FITB
GEHC
IP
IVZ
KEY
LYB
NRG
PODD
SW
WBD
WDC
WY
ZBRA
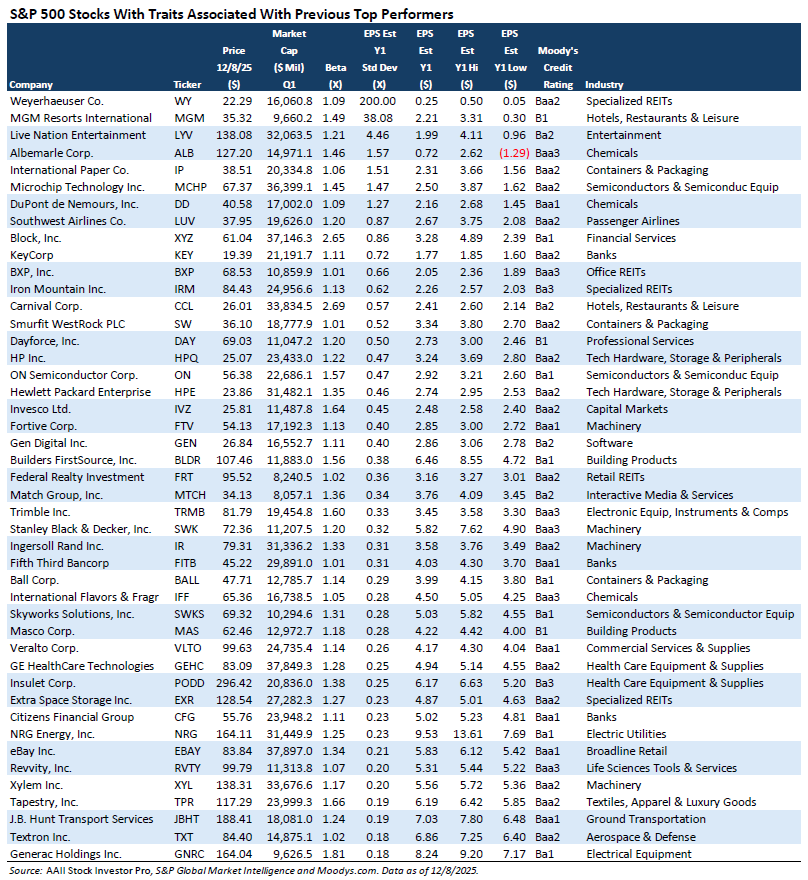
For the third consecutive year, I am sharing a list of S&P 500 index stocks with the potential to outperform in the coming year. These stocks were identified by a screen based on Martin Fridson’s book “The Little Book of Picking Top Stocks: How to Spot Hidden Gems” (Wiley, 2023). This week, I present this year’s list and provide a little added insight about specific stocks with potential catalysts for an upside run.
 First, a bit of background. Fridson analyzed the S&P 500’s previous best-performing stocks to determine if there were common traits among them. He identified five such traits: a high level of dispersion in analysts’ estimates, a size below the median of all S&P 500 stocks, relatively high levels of volatility, below-top-notch credit ratings and a catalyst to cause the price to move.
I screened for dispersion in earnings estimates, size and volatility. Dispersion was measured using the Fridson-Lee statistic, which is the highest estimate minus the lowest estimate, divided by the lowest estimate. Credit ratings were pulled from Moodys.com. There isn’t a way to quantitatively screen for catalysts.
Last year’s list found several big winners, including Western Digital Corp.  (WDC), up 146.7% over the past 12 months, Warner Bros. Discovery Inc. (WBD), up 139.5%, Expedia Group Inc. (EXPE), up 40.3%, and EQT Corp. (EQT), up 36.3%. (My wife has owned shares of Expedia for several years.)
Fridson cautioned that stocks with the potential to have a great year also have the potential “to have a very bad year.” Last year’s list included LyondellBasell Industries N.V. (LYB), Builders FirstSource Inc. (BLDR) and Zebra Technologies Corp. (ZBRA). The three stocks have lost 45.5%, 37.1% and 34.2%, respectively, over the past 12 months.
The screen’s use of earnings estimate dispersion can lead it to identify both big winners and big losers. Disagreement among analysts increases the likelihood of surprises, but those surprises can be either positive or negative.
Overall, 10 of the 24 stocks listed in the December 12, 2024, Investor Update have outperformed the S&P 500 over the past 12 months. The average price return for the passing stocks was 14.3%, versus the S&P 500’s price return of 13.5% through Monday, December 9, 2025. As noted above, we could not screen for catalysts. Including this step from Fridson’s list may have weeded out some of the underperformers.
Candidates Poised to Outperform in 2026
I reran the screen this week to identify stocks with the potential to be the S&P 500’s top performers in 2026. Stocks with Moody’s credit ratings of A or better and stocks without a credit rating were removed.
I then took the extra step of asking both ChatGPT and Claude to analyze the 45 remaining stocks for qualitative traits that Fridson found past S&P 500 top performers to have.
The artificial intelligence (AI) chatbots identified the following two companies as having new products that could potentially serve as positive catalysts.
-
Insulet Corp. (PODD): Its Omnipod automated insulin system is expected to achieve full integration with continuous glucose monitors (CGMs) across all major sensors.
-
GE HealthCare Technologies Inc. (GEHC): The company is producing innovations in diagnostic imaging equipment, radiopharmaceuticals, AI, cloud and software for medical imaging. (My wife inherited shares of GE HealthCare.)
Exposure to commodities is also a catalyst, as there is a strong link between shifts in commodity demand and earnings of companies tied to those commodities. Claude and ChatGPT identified Albemarle Corp. (ALB), Ball Corp. (BALL), International Paper Co. (IP), NRG Energy Inc. (NRG), Smurfit WestRock PLC (SW) and Weyerhaeuser Co. (WY) as all having high commodity exposure.
According to Fridson, another potential catalyst is operating in an industry with a proverbial 800-pound gorilla—that is, a dominant firm. If the dominant firm falters, it could create an opportunity for a smaller competitor to grow revenues quickly. The AI chatbots identified several companies passing the screen that compete against dominant firms, including Citizens Financial Group Inc. (CFG), Fifth Third Bancorp (FITB), KeyCorp (KEY) and Invesco Ltd. (IVZ).
The strategy behind this screen is speculative. Fridson suggested putting no more than 1% or 2% of your portfolio into a stock you believe could be next year’s top performer in the S&P 500. Make sure to do your own research before buying any of these stocks.
Alternatively, you could use the list as a starting point to identify stocks that may be worth holding for the long term. This would require spending time examining the stocks’ underlying fundamentals and valuations—factors that the screen does not consider.

-
How to Take Advantage of Risk Factors
Factors have been proven to lead to higher returns. What you need to know about tilting your portfolio toward them. -
What Helps and Doesn’t Help Find Top-Performing Stocks
Martin Fridson explains that what drives stocks to be the number-one stock in the S&P 500 in terms of one-year returns is surprises. -
Key Tax Numbers for 2025 and 2026
The December 2025 AAII Journal gives an overview of the deductions, credits, income thresholds, retirement limits and other caps, exemptions and phaseouts that determine your tax bill for this year and next.
AAII Sentiment Survey
Optimism among individual investors about the short-term outlook for stocks increased in the latest AAII Sentiment Survey. Meanwhile, neutral sentiment and pessimism decreased.
Bullish sentiment, expectations that stock prices will rise over the next six months, increased 0.3 percentage points to 44.6%. Bullish sentiment is above its historical average of 37.5% for the second time in five weeks.
Neutral sentiment, expectations that stock prices will stay essentially unchanged over the next six months, decreased 0.1 percentage points to 24.8%. Neutral sentiment is below its historical average of 31.5% for the 73rd time in 75 weeks.
Bearish sentiment, expectations that stock prices will fall over the next six months, decreased 0.2 percentage points to 30.6%. Bearish sentiment is below its historical average of 31.0% for the second time in 46 weeks.
The bull-bear spread (bullish minus bearish sentiment) increased 0.5 percentage points to 14.0%. The bull-bear spread is above its historical average of 6.5% for the sixth time in 45 weeks.
This week’s special question asked AAII members how they think the average consumer is faring relative to one year ago.
Here is how they responded:
- Worse: 56.5%
- About the same: 24.8%
- Better: 16.2%
- Not sure/no opinion: 2.2%
Bullish: 44.6%, up 0.3 points
Neutral: 24.8%, down 0.1 points
Bearish: 30.6%, down 0.2 points
Bullish: 37.5%
Neutral: 31.5%
Bearish: 31.0%
See more Sentiment Survey results.

December 4, 2025 Don't Judge a Stock by Its High or Low Share Price
November 27, 2025 Important Family Conversations for Thanksgiving Weekend
November 20, 2025 November Charts of Interest: The S&P 500 Tends to Finish Strong
November 13, 2025 I Rebalanced for the First Time Since 2021

Discussion
Barry from TX posted 7 months ago:
Charles, (1) knowing what stocks were the hottest last year is like missing the last plane that will get you home tonight to your family. It’s worth about as much as John Nance Garner’s estimation of the job after being FDR’s Vice President. (2) I suggest Mr. Frison and any AAIIers who want to learn a systematic method for estimating, read up on the Fermi Estimation process that is widely known as a scientific method for generating estimates of something you “think” you don’t know. (3) You always know more than you think you do. You need a systematic process and a willingness to do some basic research. See @ https://en.wikipedia.org/wiki/Fermi_problem. (4) There is ample academic research on “anomalies” (aka factors) that sound like they may qualify as price-moving catalysts. I am fairly certain that this fact serves as the basis for several AAII screens. (5) The AAI Sentiment-Market Model employs 12-15 well-known sentiment and market indicators and produces line-chart graphs of them each week, AND maintains a historical database for indicator performance for about 40 years and regularly refers to these data as a reliable basis to “estimate” recent market movements. (6) An example (from a book I read) wanted to estimate the number of piano tuners in Chicago. Their estimation process was (a) the population of Chicago (currently 2.75M); (b) the average number of people per household (2-3); (c) the share of households that regularly tuned pianos (1 in 10-30), (d) the required frequency of piano tuning (1 per year); (5)the number of pianos one tuner can tune in one day (4-5); and (e) how many days a piano tuner works each year (250 days). The range of an estimate usually ranges from 30 to 150, with an average of 50. Consider the level of improvement from “I don’t know,” which was the starting point. The book I referenced for the Fermi Process is “How to Measure Anything” by Douglas Hubbard, 3rd Ed, Wiley 201, page 18). There are a lot more estimation tools therein. (7) "Fridson suggested putting no more than 1% or 2% of your portfolio into a stock you believe could be next year’s top performer in the S&P 500." This sounds like a very slow way to increase wealth. Investing 2% ($20,000 of a 1M PF) and getting a 50% return ($10,000) sounds like a poor understanding of the returns UST bonds can produce with a lot more certainty. A 40% bond PF would generate the same returns ($20,000) @3.5% with a lot less drama and a whole lot more time sleeping in your own bed.
Barry from TX posted 7 months ago:
Charles, I let this [dead, not sleeping] dog lie for 2 weeks waiting for anyone to comment. I gave up. The silence was intolerable. You deserve feedback, even from hacks like me, to evaluate the efficacy of your articles. #1 Charles has laid out a nice Treasure Map (the Table of 43 stocks), and all we have to do is be a Dora the Explorer … AND we need to be like Dora's best friend, Boots, who loves riddles and helps Dora find clues and solve puzzles on their adventures. #2 That sounds like Firdson’s book. It is long on adventure (risk) and short on catalysts (rewards). #3 Charles didn’t provide a list of catalysts either. #4 So we really do have an adventure on our hands and "Tenemos Amigos." #5 So I went looking for a list of catalysts. I found a SHORT LIST of the usual OBVIOUS suspects – EPS, M&A, company announcements that can ALL be anticipated by the media and published by Thomson Reuters in 5 minutes. So Fama’s famous “efficient market hypothesis” tells us that everyone has the same treasure map and boots on staff to beat us to the treasure. “#6 Ay caramaba!” to quote another recent Charles’ article. No wonder he didn’t provide a list of catalysts. Here’s the standard baker’s dozen from various internet sources: IPO, Partnership, EPS release, analyst revisions, investor conference/call, financial metrics revealed in 10Ks/10Qs, FDA/CDC product approval/release, an economic event, court decision, contracts. Remember what Dora says, "Swiper No Swiping!"
You need to log in as a registered AAII user before commenting.
Create an account