

July Charts of Interest: The Widespread Influence of AI Spending
by Charles Rotblut | July 23, 2026
Featured Tickers: AMZN
GOOGL
MSFT
SPCX
AMZN
GOOGL
MSFT
SPCX
Much that has been occurring in the U.S. financial markets has ties to spending on artificial intelligence (AI) infrastructure. It has helped widen leadership in the S&P 500 index, contributed to elevated long-term Treasury yields and generated local resistance to new data center construction. In this month’s charts of interest, we look at those current trends and find out why historical trends give reason to be a little optimistic about the second half of 2026.
As a reminder, the charts of interest highlight charts and tables I’ve come across that haven’t made their way into other AAII commentaries.
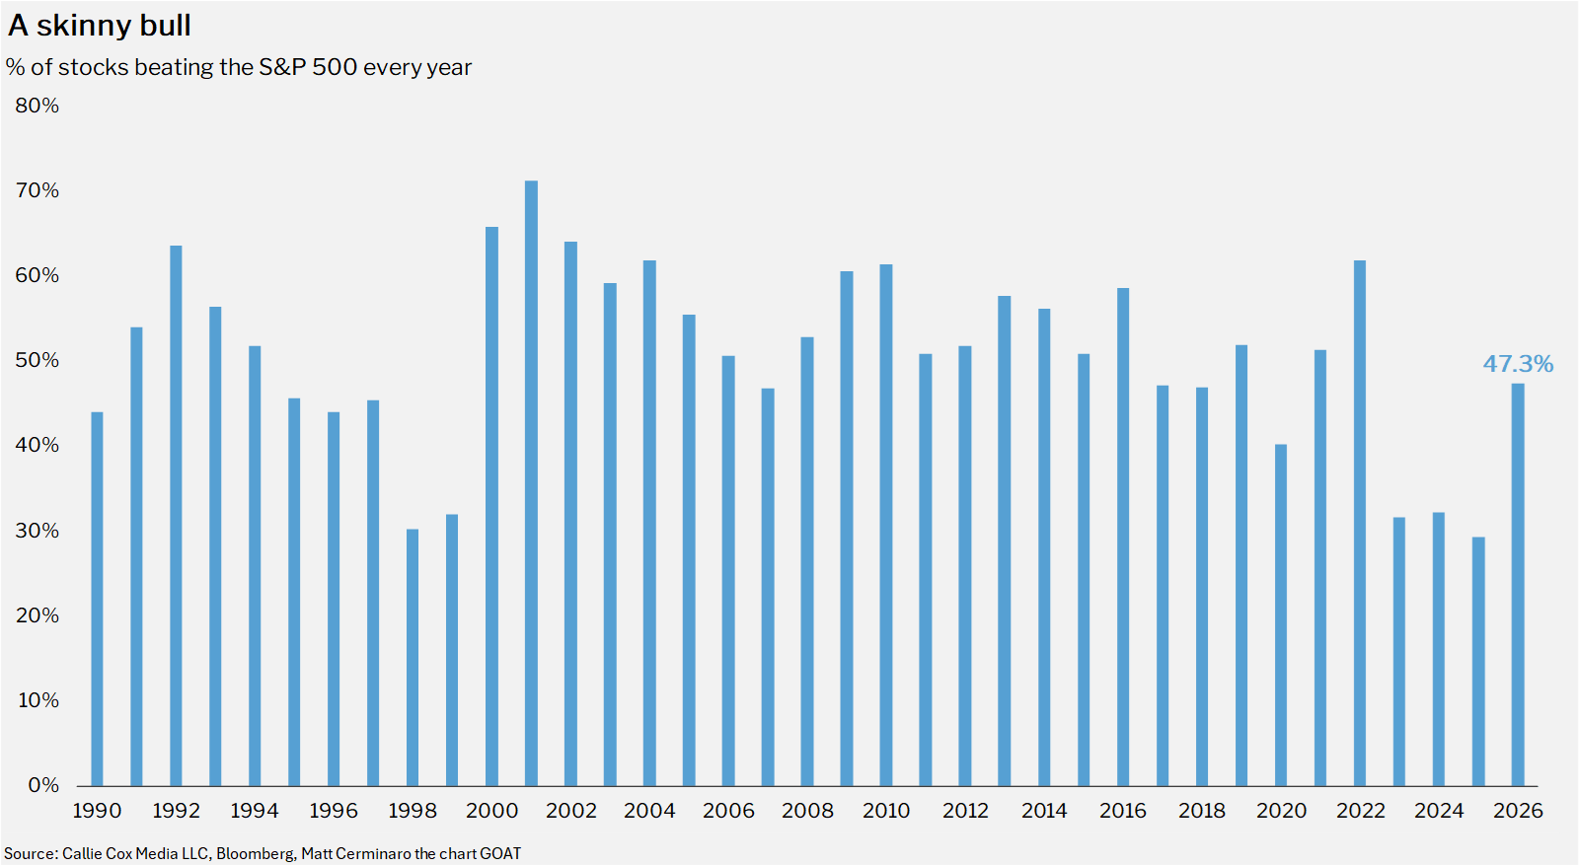
More Large-Cap Companies Are Beating the S&P 500
A shift has occurred in the markets: Leadership within the S&P 500 has broadened. Callie Cox of Ritholtz Wealth Management calculated that 47.3% of the stocks within the S&P 500 are beating the index’s performance year to date. This is the largest percentage since the bear market of 2022.
Driving broader leadership has been a shift of investor enthusiasm away from the Magnificent Seven technology giants and into other stocks. Semiconductor and technology hardware stocks have contributed, but so have oil, healthcare services and other stocks.
A Streak We Hope Continues
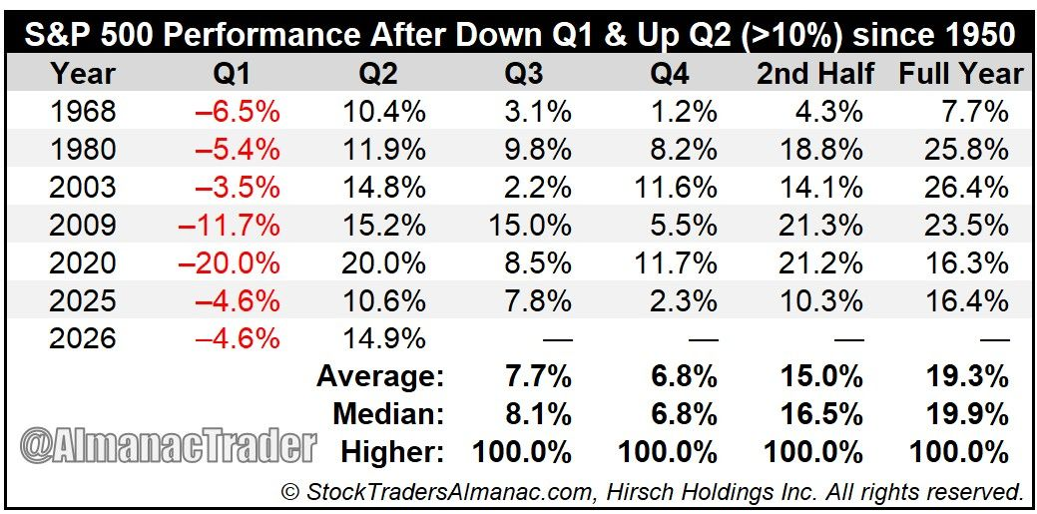
The S&P 500 stumbled in first-quarter 2026 by falling nearly 5%, before jumping roughly 15% in second-quarter 2026. The sample size of such occurrences is small, but it does suggest that odds for the second half of the year could be in the bull’s favor.
Here is what Jeffrey Hirsch of Stock Trader’s Almanac posted on LinkedIn: “Following a negative Q1, the S&P 500’s track record for the rest of the year is mixed. But when the market rebounds by more than 10% in the second quarter, the historical picture changes dramatically … In the six prior occurrences since 1950—1968, 1980, 2003, 2009, 2020 and 2025—the S&P 500 finished higher in Q3, Q4, the second half and the full year. That’s a perfect 6-for-6 record.”
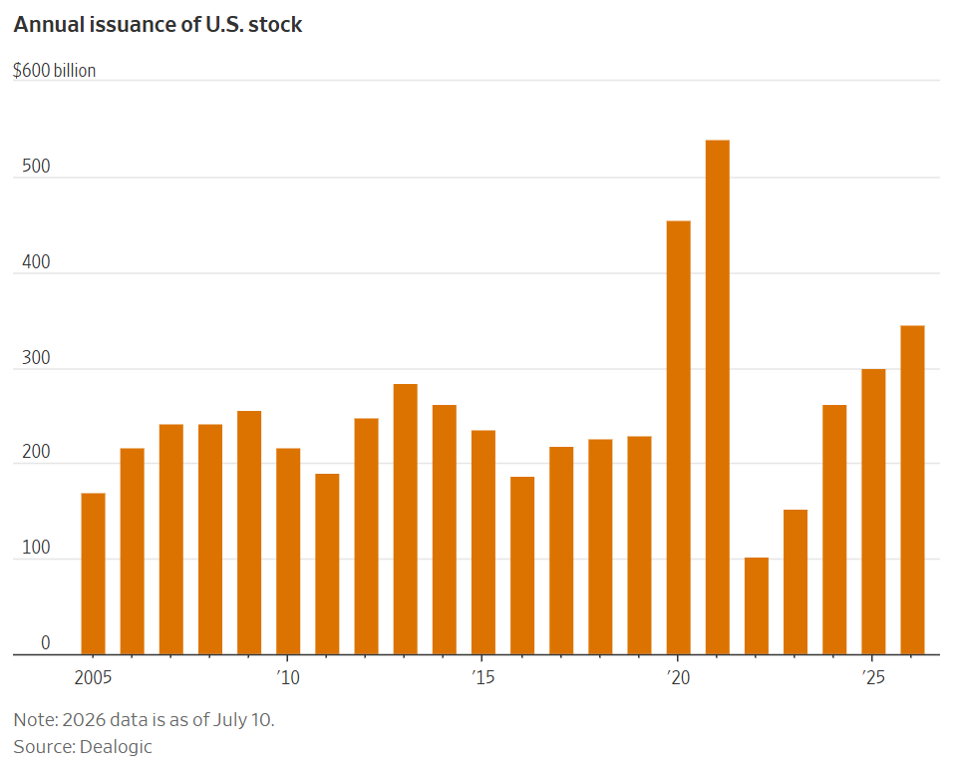
This Is a Big Year for Stock and Bond Issuances
As of last week, corporations have sold $344.7 billion worth of stock this year, according to The Wall Street Journal. This figure includes big initial public offerings (IPOs) like Space Exploration Technologies Corp.  (SPCX), more commonly known as SpaceX, as well as secondary offerings from companies like Alphabet Inc. (GOOGL).
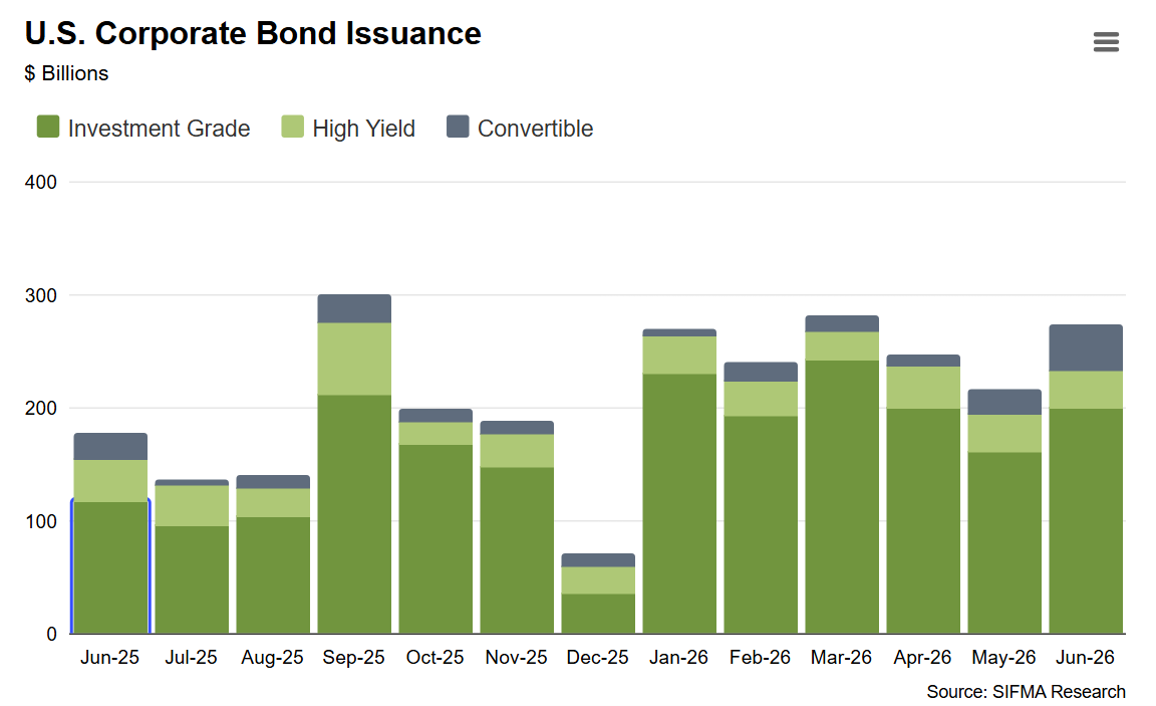
SIFMA Research tabulated $1.52 trillion of corporate debt being issued during the first half of 2026. Spending on data centers by companies like Amazon.com Inc. (AMZN) and Microsoft Corp. (MSFT) contributed to this large increase.
30-Year Bonds Yields Are Trading Above 5%
The 30-year Treasury bond yields have traded above 5% for most of July, as this chart from Yahoo Finance shows. This is the longest such streak since 2007. Rising government debt is playing a role, but so is the large number of corporate debt issuances.
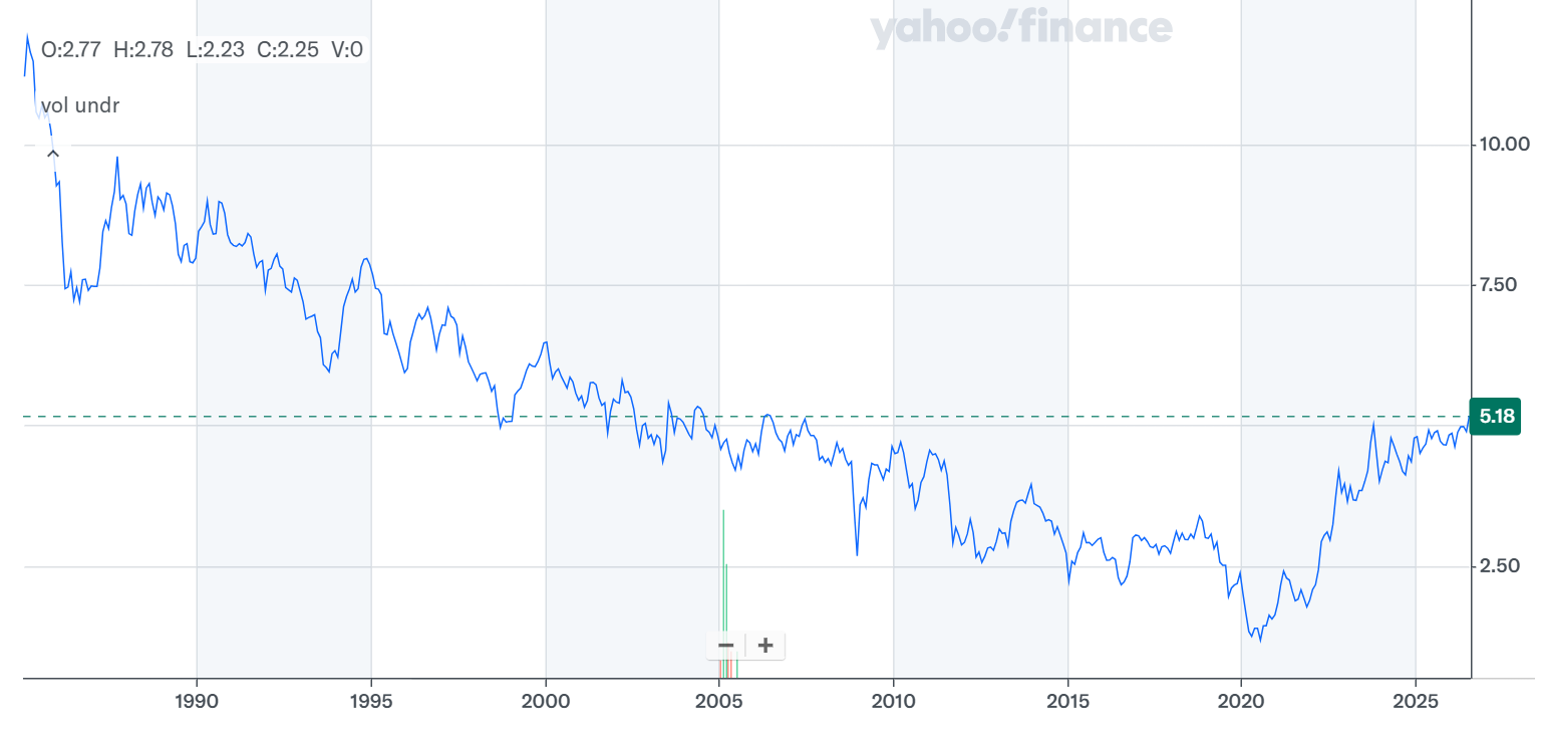
Source: Yahoo Finance.
Yields on the benchmark 10-year bond—which determine rates for mortgages, among other loans—have been a bit more stable, though they are starting to rise again. Here’s another chart from Yahoo Finance.
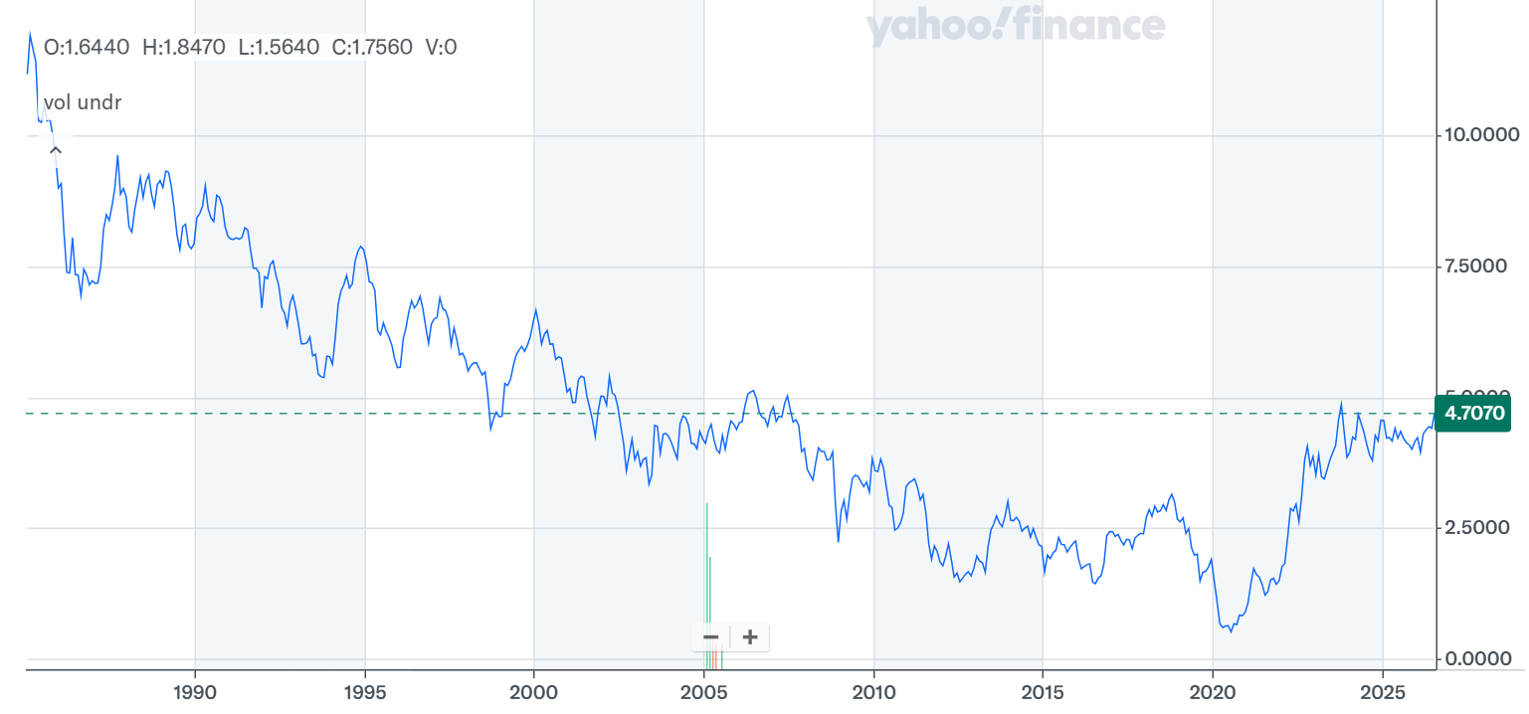
Source: Yahoo Finance.
Build That Data Center Somewhere Else
I’ve been seeing posts on my Nextdoor news feed asking for help in opposing the construction of a data center in a village near mine. Nextdoor is a neighborhood-oriented social media platform.
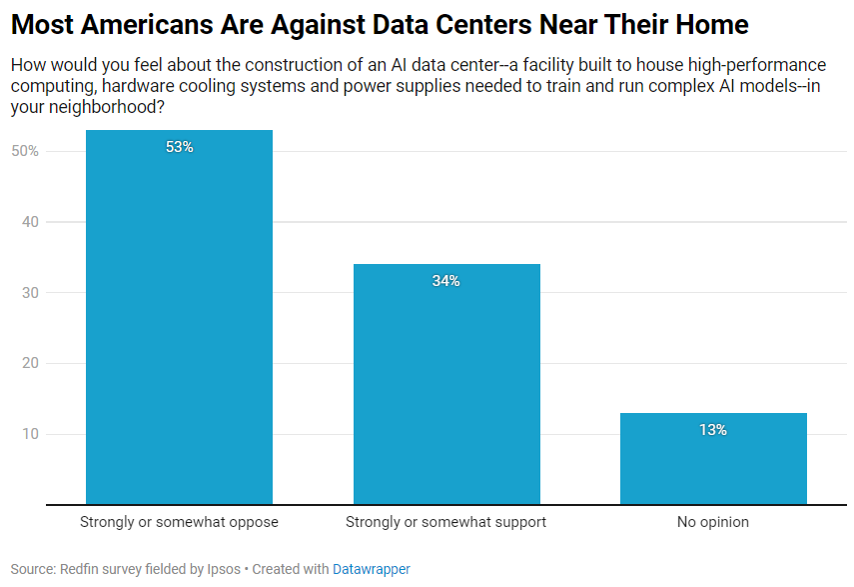
Results of a Redfin survey released yesterday found that more than half (53%) of U.S. residents oppose the construction of an AI data center in their neighborhood. This level of opposition is higher than it is for any other type of building.

-
The Put-Call Ratio: Viewing Market Sentiment Through Options Activity
During periods of fear or euphoria, the CBOE equity put-call ratio can inform your judgment by showing where sentiment may have gone too far. -
Using Bond Ladders and Income Annuities for Retirement Income
A discussion of two specific tools investors can use in retirement to generate fixed cash flows and manage relevant risks. -
The PRISM Wealth-Building Process: Putting It All Together
PRISM helps you develop a well-defined personalized plan for achieving your financial goals, as illustrated in the July 2026 AAII Journal.
AAII Sentiment Survey
Optimism among individual investors about the short-term outlook for stocks decreased in the latest AAII Sentiment Survey. Meanwhile, neutral sentiment and pessimism increased.
Bullish sentiment, expectations that stock prices will rise over the next six months, decreased 15.3 percentage points to 29.6%. Bullish sentiment is below its historical average of 37.5% for the third time in four weeks.
Neutral sentiment, expectations that stock prices will stay essentially unchanged over the next six months, increased 5.8 percentage points to 28.1%. Neutral sentiment is below its historical average of 31.5% for the 105th time in 107 weeks.
Bearish sentiment, expectations that stock prices will fall over the next six months, increased 9.5 percentage points to 42.3%. Bearish sentiment is unusually high and is above its historical average of 31.0% for the 24th consecutive week.
The bull-bear spread (bullish minus bearish sentiment) decreased 24.8 percentage points to –12.8%. The bull-bear spread is unusually low and is below its historical average of 6.5% for the third time in four weeks.
This week’s special question asked AAII members how they think inflation in the second half of 2026 will compare to inflation in the first half of the year.
Here is how they responded:
- The rate of inflation will be similar to that of the first half of the year: 41.1%
- The rate of inflation will be higher: 31.4%
- The rate of inflation will slow: 23.2%
- Not sure/no opinion: 3.8%
Bullish: 29.6%, down 15.3 points
Neutral: 28.1%, up 5.8 points
Bearish: 42.3%, up 9.5 points
Bullish: 37.5%
Neutral: 31.5%
Bearish: 31.0%
See more Sentiment Survey results.

July 16, 2026 How to Build an Earnings Season Watchlist
July 9, 2026 Extreme Accounting Numbers Deserve a Closer Look
July 2, 2026 The Stock Market at Midyear: Big Gains Fueled by Earnings Growth
June 25, 2026 What Makes Perpetual Futures So Risky?

Discussion
DENNIS from CA posted 2 months ago:
"A Streak We Hope Continues" You hope stocks become more expensive for folks who will be net buyers of stocks?? OK....
Barry from TX posted 2 months ago:
Charles, #1 I greatly appreciate your COIs. You take time to find and use DATA to explain current trends in market factors that AAIIers need to understand. The AAII Sentiment Survey is strictly OPINION-based, relying on the main 3 statistical movements to explain current trends in market factors and investors' sentiment. However, I am not aware of any studies that anyone has conducted to relate AAII member investment portfolio allocations to the AAII Sentiment Survey opinions they report to explain any relationships. #2 The eponymous “Ass-u-me Principle” explains how important your approach is for informing AAIIers. Thanks for your efforts to help us become more data-focused. #3 At 53%, the current NIMBY DC survey data reported is also a coin flip that most likely varies widely ‘hood-by-‘hood week-to-week. I know from recent experiences with an “affordable housing” effort in Texas, my city, and neighborhood that NIMBY IS A POTENT FORCE that evokes principles similar to the ones that created the founding of our country after 1753. “BIG money” should be paying attention to the depth of intensity for homeownership and the importance of maintaining homeownership equity/value as part of a retirement portfolio. Homeowners tend to vote at a much higher rate than renters. #4 The Ritholtz 47% data on SPX (yet another coin flip) is subject to the same main 3 statistical movements ALL current data trends face … and these current trends face a choppy and volatile near-term period where data trends may shift quickly as events evolve. The six Ritholtz data points tend to prove this observation. (#1) after 1968 a recession produced early 1970s inflation that unwound markets; (#2) 1980 recession followed the same forces (oil shortage/Iran revolution) as today; (#3) the 2003 dot.com recovery turned into (#4) the 2008 and 2009 deep “Great Financial Crisis” that lasted almost 10 years; (#5) the 2020 (Covid recession) produced a $7.5T government deficit we are still fighting, and (#6) 2025 was an extreme positive outlier that produced the trends you cited here. #5 As Bete Davis famously said, “Fasten your seatbelts, it's gonna be a bumpy ride." She also is reported to have said, "Old age ain't no place for sissies." Conclusions: Know that 50%-50% data (like market prices) has ephemeral value. Diversify your portfolio (not necessarily Ex-US, it's even crazier there). Learn from the past. Pay off your mortgage. Get to know your neighbors; their vote can offset your vote. Stay vested in AAII.
Barry from TX posted 2 months ago:
Jeffrey Hirsch, Editor-in-Chief at Stock Trader's Almanac, is an extremely reliable source of data analysis. I read his LinkedIN post, “After Down Q1 and 10%+ Q2, S&P 500 Is 6-for-6 the Rest of the Year,” and these are some points YOU NEED TO CONSIDER. #1 The very SMALL SAMPLE SIZE (6 in 75 years) + #2 the 8% PROBABILITY it produces sets up VERY LONG ODDS, AND #3 the closing demur Hirsch presents, "None of this precludes a dip. August and September have a long history of producing volatility, and a pullback during the third quarter would not be unusual. This could be the year the 6-for-6 streak ends," dilutes the power of this well-presented argument. Go flip a coin 6 times to see how weak this argument is. If you get 5 or 6 out of 6 heads, go buy a Powerball ticket and then invest it all in the market.
You need to log in as a registered AAII user before commenting.
Create an account