

Don't Judge an Index Fund by Its Cover
by Charles Rotblut | April 08, 2021
Featured Tickers: GRMCXLDPCX
 LDVCX
RYCOX
RYDKX
RYGRX
RYSYX
RYVVX
SNXFX
TVRCX
VFIAX
VIGAX
VLCAX
VTSAX
LDVCX
RYCOX
RYDKX
RYGRX
RYSYX
RYVVX
SNXFX
TVRCX
VFIAX
VIGAX
VLCAX
VTSAX
Index mutual funds mostly have lower expense ratios than their actively managed peers. When a fund is tracking an index, it does not incur the expense of having to research each potential investment candidate. In addition, index fund turnover is frequently less than that of actively managed funds.
This isn’t always the case. Some index funds are downright expensive. Eight non-institutional domestic large-cap funds charge expense ratios in excess of 2%.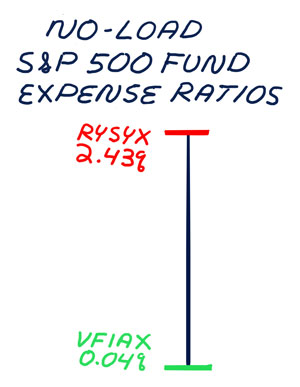
The number seems surprising. Even for an actively managed fund, the expense ratio is high. So, I went to the fund sponsors’ websites to confirm the data. The expense ratios are actually above 2%. They are a good example of why you shouldn’t judge an index fund simply by its cover, so to speak.
Six of the eight funds are offered by Guggenheim. In each case, they are class C shares. These are mutual funds available to individual investors without a front-load being charged. The funds are Guggenheim Directional Allocation C (TVRCX), Rydex NASDAQ-100 C (RYCOX), Rydex S&P 500 Pure Growth C (RYGRX), Rydex S&P 500 Pure Value C (RYVVX), Rydex S&P 500 C (RYSYX), and Rydex Dow Jones Industrial Average C (RYDKX).
The other two funds invest in private equity and venture capital: AXS Thomson Reuters Private Equity Return Tracker C (LDPCX) and AXS Thomson Reuters Venture Capital Return Tracker C (LDVCX). We can debate as to whether they are actually large-cap funds—even though that’s how Morningstar classifies them—but doing so doesn’t change the expense ratios charged. A passive approach to a costly investment strategy is still an expensive way to invest.
Most index mutual funds do not charge anywhere near these amounts. Six domestic large-cap funds have expense ratios of 0.04% or 0.05%. They are Vanguard 500 Index Admiral (VFIAX), Vanguard Total Stock Market Index Admiral (VTSAX), Schwab 1000 Index (SNXFX), Vanguard Growth Index Admiral (VIGAX), Vanguard Large Cap Index Admiral (VLCAX) and Vanguard Value Index Admiral (VVIAX). The expense ratios charged by these funds are comparable with the cheapest exchange-traded funds (ETFs).
The cheapest index funds are mostly those following large, well-known indexes. Following a large, well-known index and also being cheap is not a hard and fast rule. Even a cursory scan finds S&P 500 funds with higher expense ratios than you would expect. Nationwide S&P 500 Index C (GRMCX) has an expense ratio of 1.27%. It’s a high cost to pay, especially if it is easy to switch to an alternative fund charging a much lower expense ratio.
Besides taking the expense ratio into consideration, you should also look at what the fund invests in. Merely having “S&P 500” or “large-cap” in its name does not necessarily mean a fund’s portfolio is what you think it is. A mutual fund or ETF could target a subset of the S&P 500 or use a different weighting than the actual index does. If you have questions about the strategy, go to the mutual fund or ETF family’s website and read the literature. If you still can’t figure it out, then it might not be the fund for you.

- This past November, AAII president John Bajkowski published a chart demonstrating how higher expense ratios reduce wealth.
- I will explain how to analyze a fund on Wednesday, April 21.
- Since April is Financial Capability Month, we asked FINRA’s Christine Kieffer to offer suggestions on how to get family members interested in investing. More suggestions will be offered on our upcoming April 14 episode of The Individual Investor Show.
- Also as part of Financial Capability Month, AAII Journal contributing editor Craig Israelsen explains how asset allocation impacts retirement income.
AAII Sentiment Survey
Optimism among individual investors about the short-term direction of the stock market jumped to its highest level in more than three years. The latest AAII Sentiment Survey also shows bearish sentiment at its lowest level in two years.
Bullish sentiment, expectations that stock prices will rise over the next six months, rose 11.1 percentage points to 56.9%. Bullish sentiment was last higher on January 3, 2018 (59.8%). Optimism is above its historical average of 38.0% for the 19th week out of the past 21 weeks.
Neutral sentiment, expectations that stock prices will stay essentially unchanged over the next six months, fell 8.3 percentage points to 22.7%. Neutral sentiment was last lower on November 11, 2020 (19.3%). Neutral sentiment remains below its historical average of 31.5% for the 60th time out of the past 64 weeks.
Bearish sentiment, expectations that stock prices will fall over the next six months, declined 2.8 percentage points to 20.4%. Bearish sentiment was last lower on April 24, 2019 (20.2%). Bearish sentiment is below its historical average of 30.5% for the ninth time this year.
The difference between optimism and pessimism is 36.5 percentage points. This is the widest the bull-bear spread has been since January 3, 2018 (44.2 percentage points). At current levels, bullish sentiment is unusually high and both neutral and bearish sentiment are unusually low. Historically, both above-average readings for bullish sentiment and below-average readings for bearish and neutral sentiment have been followed by below-average six- and 12-month returns for the S&P 500 index.
The ongoing coronavirus pandemic, including the distribution of vaccines, continues to have a big influence on individual investors’ outlook for the stock market. Other factors include the new administration’s policies, economic trends, the current level of valuations and economic stimulus.
For this week’s special question, we asked AAII members how the coronavirus pandemic (including the vaccinations as well as the recent rise in cases) is influencing their outlook for stock prices.
Nearly two out of five respondents (39%) say that they expect stock prices to rise as more people are vaccinated and businesses return to normal. This compares to 20% of respondents who say that the pandemic is having little to no impact on their outlook for stock prices.
In addition, about 20% of respondents say that they think the market is overpriced and that they think there is a gap between valuations and fundamentals. Many within this category also state that overly optimistic sentiment in the market could result in a correction toward the end of the year. About 12% of respondents say that they remain bearish and cautious.
Here is a sampling of the responses:
- “Vaccinations have created optimism for the economy, but valuations are still too high, so my outlook for stocks is pessimistic.”
- “Vaccinations are giving people a sense of ease about getting back to their normal recreational outings (dining out, gyms, etc.). However, eventually investors are going to realize how much additional debt and especially risky debt has been added as the additional bankruptcies and bond downgrades start occurring. There are many renters, student debt borrowers and mortgagees who aren’t making payments. Many of these will default. I believe the market is fully priced and this will cause the realization that the future isn’t all rosy and growth.”
- “I think there is a pent-up demand by consumers to get out of the house and start returning back to a normal life. I would expect restaurants, travel and entertainment venues to have a lot of business in the next six months.”
- “I think the stock market will go up in the short term and then correct due to the poor fundamentals.”
- “Concerned that the market may have gotten ahead of itself with too much optimism, particularly since employment levels are still down on an absolute basis. European stocks, by contrast, may reflect too much pessimism since they will eventually get their vaccination programs on track.”
Bullish: 56.9%, up 11.1 points
Neutral: 22.7%, down 8.3 points
Bearish: 20.4%, down 2.8 points
Bullish: 38.0%
Neutral: 31.5%
Bearish: 30.5%
See more Sentiment Survey results.

AAII Asset Allocation Survey
Individual investors’ exposure to equities reached a 37-month high in March according to the latest AAII Asset Allocation Survey. Fixed-income allocations, meanwhile, declined to a 29-month low.
Stock and stock fund allocations increased by 2.3 percentage points to 70.0%, marking the 10th consecutive month that equity allocations are above the historical average of 61.0%. Equity allocations were last higher in February 2018 (70.1%).
Bond and bond fund allocations pulled back by 0.7 percentage points to 15.3%, falling below its historical average of 16.0% for the first time since February 2019 (15.8%). Fixed-income allocations were last lower in October 2018 (13.3%).
Cash allocations decreased 1.5 percentage points to 14.7%, marking a 14-month low and the 11th consecutive month cash allocations have been below their historical average of 23.0%. Allocations in cash were last lower in January 2020 (13.8%).
Individual investors’ exposure to equities reached an unusually high level in March (more than one standard deviation above the historical average). Bullish sentiment was at an unusually high level throughout much of March. At the same time, rising stock prices and falling bond prices shift allocations—even for those investors who made no changes to their portfolios.
- Stocks and Stock Funds: 70.0%, up 2.3 percentage points
- Bonds and Bond Funds: 15.3%, down 0.7 percentage points
- Cash: 14.7%, down 1.5 percentage points
- Stocks: 30.8%, up 1.8 percentage points
- Stocks Funds: 39.2%, up 0.5 percentage points
- Bonds: 2.4%, up 0.3 percentage points
- Bond Funds: 13.0%, down 1.0 percentage points
- Stocks/Stock Funds: 62.0%
- Bonds/Bond Funds: 16.0%
- Cash: 22.0%
Take the Asset Allocation Survey.
April 1, 2021 Some Valuations Are Too High
March 25, 2021 One Year Later: Seven Lessons From the Coronavirus Bear Market
March 18, 2021 A Quick Tax Update, Plus a Look at Projected Earnings for 2021
March 11, 2021 Diversification's Impact Depends on Time Measured

Discussion
Vaidy Bala from AB CANADA posted over 5 years ago:
I quit MF a long time ago because of high MER, not disclosed upfront in writing. Canada is a small reflection of US funds, not different. ETFs I invested did not make me rich although about two decades went into it, passively. I wish AAII would cover Canada universe and increase the appetite for Canadian Individual Investors like me. Of course the exchange rate bite of 25 to 40% is market economy, but there is the truth, US is the world market place buzzing with activity. I thank for the coverage of Driehause. His philanthropy and business model impressed me. Thanks for the review. I appreciate the honesty in coverage. sincerely Vaidy Bala Canadian Individual Investor
You need to log in as a registered AAII user before commenting.
Create an account