

A Quick Tax Update, Plus a Look at Projected Earnings for 2021
by Charles Rotblut | March 18, 2021
Yesterday, the Internal Revenue Service (IRS) gave everyone an extra month to file their 2020 taxes. The new deadline for filing federal taxes is May 17, 2021.
This extension is NOT universal. First-quarter federal estimated tax payments are still due on April 15, 2021. Check with your state to see whether they have moved their deadline before assuming you have extra time. Here in Illinois, the deadline for filing state taxes is still April 15. Those living in federally designated disaster areas in Texas, Oklahoma and Louisiana related to last month’s winter storms have until June 15, 2021, to file their federal taxes.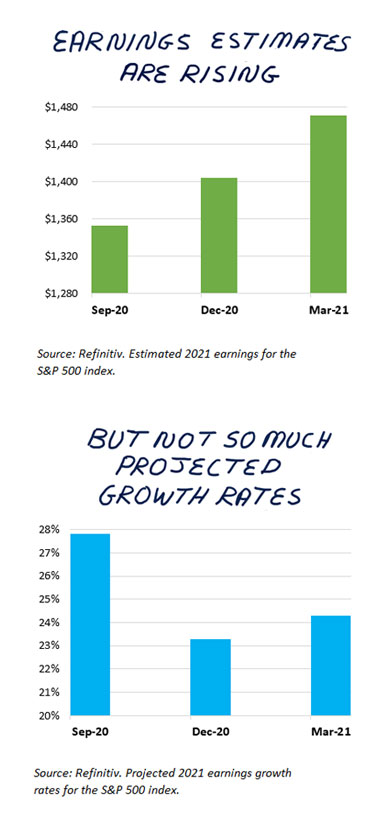
It is not clear whether the deadline for making 2020 contributions to individual retirement accounts (IRAs), Roth IRAs or health savings accounts (HSAs) will be moved. Until we hear otherwise, assume the April 15 deadline still holds.
The latest round of stimulus checks is based on the most recently filed tax returns. For many people, this will mean their 2019 income will be used to determine eligibility. If 2020 tax returns were filed and processed in time, those will be used to determine eligibility. There’s a helpful stimulus check FAQ on Bloomberg for those of you who have questions about the recent round.
Earnings Estimates Are Rising, but Growth Rates Not So Much
To the extent that the stock market is forward-looking, it is currently pricing in stronger growth. Given this, it would be logical to expect brokerage analysts to be raising their estimates for corporate earnings. This is what is occurring, but aggregate growth rates themselves aren’t significantly changing.
Two sets of numbers will put things into perspective. Both are from Refinitiv, which compiles projections from various analysts and market strategists to calculate consensus estimates. The consensus estimate is simply the average of all analyst forecasts for a given stock or index.
Earnings for the S&P 500 index companies are currently projected to reach $1,471.3 billion this year. This compares to the December 30, 2020, consensus forecast for 2021 earnings to reach $1,404.5 billion. Going back six months to September 30, 2020—and before the vaccines received emergency use authorization—the consensus forecast called for 2021 earnings of $1,352.7 billion. This is a clear and upward trend in earnings estimates. (Those projections are for the entire index as opposed to the traditional earnings per share figures you may be used to seeing.)
The projected earnings growth rate for 2021 is currently 24.3%. This is above the 23.3% growth rate projected as of December 30, 2020, though not significantly better. However, it is below the 27.8% increase projected at the end of September.
This disparity is being caused in part by 2020 earnings. The current blended estimate of $1,180.6 billion is above the three-month-old and six-month-old forecasts of $1,136.6 billion and $1,060.3 billion, respectively. The current blended earnings estimate for 2020 has risen by a larger percentage amount than forecasts for 2021 have. Hence, the growth rate for 2021 has decreased, even though forecasts have risen.
(Blended earnings estimates combine forecast and actual earnings. As of last Friday, three members of the S&P 500 had still not announced their quarterly results.)
When looking at analysts’ earnings estimates, there are three things to keep in mind. First, the further out into the future that earnings are projected, the less accurate they become. Second, earnings estimates for the most current quarter are often too conservative—particularly as quarterly and annual results are about to be announced. Since 1994, 65% of S&P 500 companies have reported better-than-expected profits. The beat rate has been 79% over the past four quarters. Third, the direction of revisions matters.
Positive (upward) revisions to earnings estimates at the company level are associated with better-performing stock prices. Negative (downward) revisions to a company’s earnings are associated with lower-performing stock prices. This can be seen in the performance of the AAII Stock Screens. The Estimate Revisions Up screens have the best 10-year returns of any our factor screens. The Estimate Revisions Down screens have among the worst 10-year returns.
Of course, growth and the trend in estimates revisions are just two factors in the investment decision process. Price is another. The S&P 500 is trading at a forward price-earnings ratio of 22.5. The Russell 2000 index is pricier with a forward price-earnings ratio of 34.1.
Such valuations are not completely surprising given expectations for economic growth to accelerate as more people become vaccinated and—hopefully—new coronavirus case counts fall. The big question is whether we’ll get enough growth to justify the valuations. If this does occur, earnings estimates for both individual corporations and for the broader S&P 500 should be revised higher. Time will tell. As I’ve said many times before, every forecaster has a cracked crystal ball.

- We’ve updated our Tax Guide with the new filing deadline.
- I discussed earnings estimate revisions in greater detail in this Investor Professor column.
- Two stocks were added to the Model Shadow Stock Portfolio this week. The portfolio’s company size rule was also adjusted.
- The Federal Open Market Committee maintained its current monetary policy at this week’s meeting. Interest rates aren’t the only thing affecting bond prices. Credit ratings also impact bond prices.
- We’re partnering with our Charlotte and Research Triangle Chapters for a fireside chat with Schwab’s strategist Liz Ann Sonders. The event will be broadcast live next Wednesday evening.
AAII Sentiment Survey
Optimism among individual investors about the short-term direction of the stock market is at an unusually high level for the second consecutive week despite declining slightly. Pessimism and neutral sentiment both rebounded.
Bullish sentiment, expectations that stock prices will rise over the next six months, fell 0.5 percentage points to 48.9%. Optimism is above its historical average of 38.0% for the 16th week out of the past 18 weeks.
Neutral sentiment, expectations that stock prices will stay essentially unchanged over the next six months, increased 0.4 percentage points to 27.5%. Neutral sentiment remains below its historical average of 31.5% for the 57th time out of the past 61 weeks.
Bearish sentiment, expectations that stock prices will fall over the next six months, increased 0.1 percentage points to 23.6%. Bearish sentiment is below its historical average of 30.5% for the sixth time this year.
As noted above, bullish sentiment remains at an unusually high level (more than one standard deviation above its historical average). The breakpoint between typical and unusually high readings is 48.0%. Historically, unusually high levels of bullish sentiment have been followed by lower-than-average six- and 12-month returns for the S&P 500 index.
The ongoing coronavirus pandemic, including the distribution of vaccines, continues to have a big influence on individual investors’ outlook for the stock market. Other factors include the new administration’s policies, economic trends, the current level of valuations and economic stimulus.
In this week’s special question, we asked AAII members how the Nasdaq composite’s recent volatility has affected their shorter-term outlook for stocks.
Half of respondents (50%) say that the Nasdaq’s recent volatility is having little to no impact on their shorter-term outlook. This compares to 12% of respondents who say that their shorter-term outlook for stocks is more bearish and that they are being more cautious. About 11% of respondents say that they are moving out of technology stocks while about 10% of respondents say that they have been using the dips as buying opportunities. In addition, about 7% of respondents say that they are shifting more toward value stocks and 7% of respondents say that their short-term outlook is more bullish.
Here is a sampling of the responses:
- “I am looking at trimming back a little on tech stocks generally, but I also accept that some individual stocks I own will have higher-than-average volatility. However, that does not negate their potential for long-term gains, so I just have to ride the roller coaster if I want to see that return.”
- “It affords an opportunity to invest in some highly profitable companies at slightly less inflated valuations. In my case, I initiated a small position in such a firm: a semiconductor company with an above-market-average dividend and lower-than-market-average price-earnings (P/E) ratio.”
- “What goes up must come down. I am one of those who remembers when the Nasdaq was mostly start-ups and small caps. Maybe strong performance of small caps over the past few months—at least as measured by my iShares Core S&P Small-Cap ETF (IJR)—is what the future holds. Small-caps have historically outperformed in a recovering environment.”
- “It has not affected my long-term outlook, but I do see the Nasdaq having a lot of volatility over the next few months.”
Bullish: 48.9%, down 0.5 points
Neutral: 27.5%, up 0.4 points
Bearish: 23.6%, up 0.1 points
Bullish: 38.0%
Neutral: 31.5%
Bearish: 30.5%
See more Sentiment Survey results.

March 11, 2021 Diversification's Impact Depends on Time Measured
March 4, 2021 Warren Buffett Shares His Thoughts About Shareholders
February 25, 2021 A Look at the Bond Market's Expectations for Inflation
February 18, 2021 Not Your Parent's Ma Bell

Discussion
No comments have been added yet. Add your thoughts to the discussion!
You need to log in as a registered AAII user before commenting.
Create an account