

Diversification's Impact Depends on Time Measured
by Charles Rotblut | March 11, 2021
Investors are constantly reminded to diversify. Doing so is particularly important for those holding individual stocks or bonds, as company or issuer-related risk (aka idiosyncratic risk) comes into play.
At the broader asset class and asset group level, it’s not always clear as to whether diversification is working. One’s perception of the right mix will depend on what period they look at.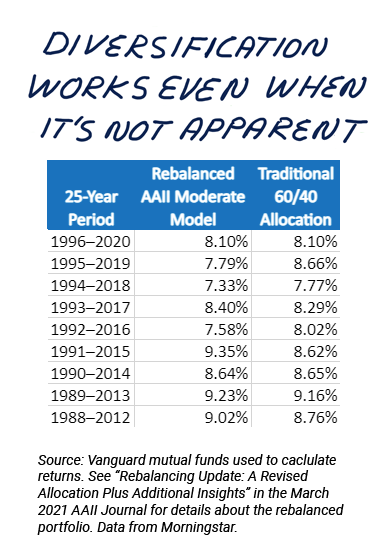
To illustrate, I’m going to use data from my long-running analysis of portfolio rebalancing. The analysis uses a simplified version of AAII’s moderate allocation model as well as the traditional 60/40 stock/bond allocation mix. (The moderate allocation model allocates 60% to a diversified mix of stocks and 40% to bonds whereas the traditional 60/40 portfolio is simply 60% large-cap stocks and 40% bonds.) Though these allocations may differ from the approach you follow, the general observations and takeaways are still worth paying attention to.
Over the 33-year period of 1988 to 2020, the 60/40 portfolio outperformed the rebalanced moderate allocation portfolio with a 9.3% annualized gain versus a 9.0% rise, respectively. When one looks at what happened annually, the 60/40 portfolio’s outperformance was boosted by three specific periods: the early 1990s, the mid-to-late 1990s and the late 2010s. In all three periods, domestic large-cap stocks outperformed international stocks by a wide margin.
The data from rolling 25-year periods paints a somewhat different picture. The 60/40 portfolio success rate of outperforming is just a little over 50% for nine 25-year rolling periods starting in 1988. Though the most recent rolling period of 1996–2020 gave the 60/40 portfolio a 5-4 edge in terms of realizing higher returns, the difference in annualized returns for the period was a scant 0.01% on a rounded basis; essentially a tie in terms of performance.
Not shown in any of these numbers is how frequently large-cap stocks (defined as the S&P 500 index) were the best-performing asset class group. The number is 10 out of 33 calendar years. This is based on relative performance of Vanguard index funds tracking domestic large-cap, mid-cap and small-cap stocks as well as international stocks and bonds. So, if you put all of your equity eggs into an only-S&P 500 basket, you run the risk of not being allocated to the right type of stocks in any given year.
International stocks have outperformed the S&P 500 during several calendar years. So have emerging market stocks, domestic mid-cap stocks and domestic small-cap stocks. Small-cap stocks have realized decisively higher returns than their large-cap counterparts over the long term.
Does this outperformance occur every year? No, and that is why you may not think diversification is working. But even when its benefit isn’t as perceivable, diversification is still doing its job.

- AAII Journal contributing editor Craig Israelsen found that diversification helps portfolios hold up better in retirement.
- The long-running analysis of portfolio rebalancing I mentioned above is included in this month’s AAII Journal. I included newer insights from Vanguard about how to minimize the tax impact of rebalancing.
- Just as the benefits of diversification are realized over the long term, so are the benefits of allocating to small-company stocks, like those held in the Model Shadow Stock Portfolio, as John Bajkowski explains.
- Be sure to tune in next Wednesday for a new episode of The Individual Investor Show. We’ll discuss Dividend Aristocrats and international fund first cuts, as well as portfolio rebalancing.
- This morning, Driehaus Capital Management announced the death of its founder, Richard Driehaus. He was 78. Wayne Thorp revisited Driehaus’ approach in 2019. Our Driehaus Revised Screen is one of the guru stock screens available to AAII members.
AAII Sentiment Survey
The percentage of individual investors describing their short-term outlook as “bullish” reached a 16-week high in the latest AAII Sentiment Survey. Meanwhile, both pessimism and neutral sentiment fell.
Bullish sentiment, expectations that stock prices will rise over the next six months, rose 9.2 percentage points to 49.4%. Bullish sentiment was last higher on November 11, 2020 (55.8%). Optimism is above its historical average of 38.0% for the 15th week out of the past 17 weeks.
Neutral sentiment, expectations that stock prices will stay essentially unchanged over the next six months, declined 7.4 percentage points to 27.1%. Neutral sentiment remains below its historical average of 31.5% for the 56th time out of the past 60 weeks.
Bearish sentiment, expectations that stock prices will fall over the next six months, fell 1.8 percentage points to 23.5%. Pessimism was last lower on December 23, 2020 (22.0%). Bearish sentiment is below its historical average of 30.5% for the fifth time this year.
Bullish sentiment is now at an unusually high level (more than one standard deviation above its historical average). It is above the breakpoint between typical and unusually high readings of 48.0%. Historically, such readings have been followed by lower-than-average six- and 12-month returns for the S&P 500 index.
The ongoing coronavirus pandemic, including the distribution of vaccines, continues to have a big influence on individual investors’ outlook for the stock market. Other factors include the new administration’s policies, economic trends, the current level of valuations and economic stimulus.
For this week’s special question, we asked AAII members to share their thoughts about fourth-quarter earnings.
A little more than half of respondents (55%) describe fourth-quarter earnings as being better than expected. Many within this group say that the positive earnings for the quarter demonstrate the market’s and economy’s recovery from the coronavirus pandemic. This compares to 21% of respondents who say that the results from the fourth quarter were mixed across different industries. In addition, about 8% of respondents say that fourth-quarter earnings were lower than expected.
Here is a sampling of the responses:
- “Better than expected for the stay-at-home stocks, good for the industrials. Real estate investment trusts (REITs) were punished.”
- “They seem to be doing better than most people thought they would. The first quarter will tell.”
- “As the economy opens, revenues and earnings will improve, especially in ‘nonessential’ businesses, who have been hurt the most due to the shutdown.”
- “Not surprising given the fact that the market is looking forward to the end of the pandemic but held down by the elevated unemployment rate.”
- “A mixed bag of lower actual earnings from the prior year but better than analyst expectations. Companies are hesitant to forecast 2021 sales and earnings due to the coronavirus pandemic’s impact on the economy. We may be in for an ugly surprise in 2021, then a positive 2022.”
- “Industry dependent. Strong retail, strong manufacturing, neutral financial, weak tech and weak media, all compared to previous year performance.”
Bullish: 49.4%, up 9.2 points
Neutral: 27.1%, down 7.4 points
Bearish: 23.5%, down 1.8 points
Bullish: 38.0%
Neutral: 31.5%
Bearish: 30.5%
See more Sentiment Survey results.

March 4, 2021 Warren Buffett Shares His Thoughts About Shareholders
February 25, 2021 A Look at the Bond Market's Expectations for Inflation
February 18, 2021 Not Your Parent's Ma Bell
February 11, 2021 Investors' Timing Decisions Linked to Higher Volatility

Discussion
Scott from Missouri posted over 5 years ago:
While interesting you have only used the period when, after Volker in 1982 stopped the runaway inflation of the 1970's, interest rates have been in a long period of decline which has favored bonds. With likely change in that pattern going forward relying on period of declining rates will favor a bond segment of pf. For myself focused on municipals for my allocation at 15% and 15% cash with 70% stocks with diversification. And prepared to make more changes if inflation gets out of hand. Kiplinter estimate is for 2% 10 year by end of the year and ECRI future inflation gauge has called the increase in rates since summer with more to come. Last time their gauge turned up we have three years of rising rates. (2016 to 2019) Yes, it was a tame rise. This time?
You need to log in as a registered AAII user before commenting.
Create an account