

Optimism Among Individual Investors Bounced Back Last Year
by Charles Rotblut | January 25, 2024
Optimism among individual investors in our weekly AAII Sentiment Survey bounced back in 2023. The improvement came in June 2023 as bullish sentiment ended what had been a nearly perfect 18-month streak of below-average optimism.
Though AAII members felt generally more upbeat about the short-term outlook for stocks during the second half of 2023—and so far into this year—last year still ranked below average overall. The average bullish sentiment reading in 2023 was 34.7%. This is the 26th-lowest annual average in the survey’s 37-year history.
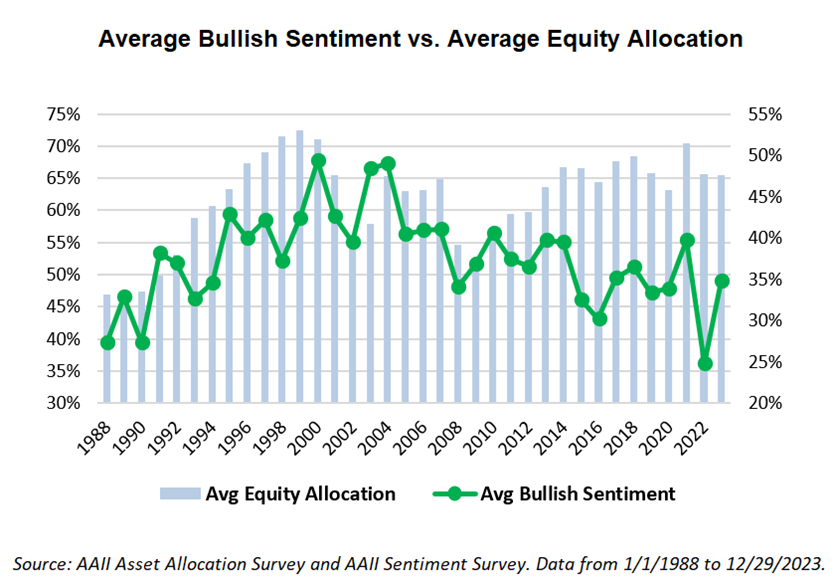 You wouldn’t be able to tell this from our Asset Allocation Survey. Equity allocations among surveyed AAII members averaged 65.6% in 2023. This ranks as the 13th-highest average exposure to stocks and stock funds over the past 37 years.
The differences between the two surveys tie back to a point I regularly reiterate: Individual investors’ short-term expectations for how the stock market will perform rarely go hand in hand with their portfolio allocations. Even with the end of the bear market and the subsequent rebounds in stock prices and optimism, average annual equity allocations were nearly unchanged between 2022 and 2023.
What last year did was give us more data on how the S&P 500 index performs following unusually low readings for bullish sentiment and unusually high readings for bearish sentiment. A reading is categorized as unusual if it is more than one standard deviation above or below its historical average. The averages have been updated for each of the survey’s approximate 1,900 weeks to avoid any hindsight bias in the calculations.
The average six-month gain in the S&P 500 following unusually low bullish sentiment readings in the AAII Sentiment Survey is 6.7%. The median is 6.9%. Both are slightly higher than they were at the end of 2022 (increases of 0.1 and 0.2 percentage points, respectively). Due to last year’s bear market, 30 additional six-month periods were added. This brought the total count of six-month periods used in the calculation to 264.
The S&P 500’s six-month return following unusual bull-bear spreads—the difference between bullish and bearish sentiment—also slightly improved. The average six-month return increased by 0.1 percentage points to 5.8%. The median gain increased by 0.3 percentage points to 6.9%.
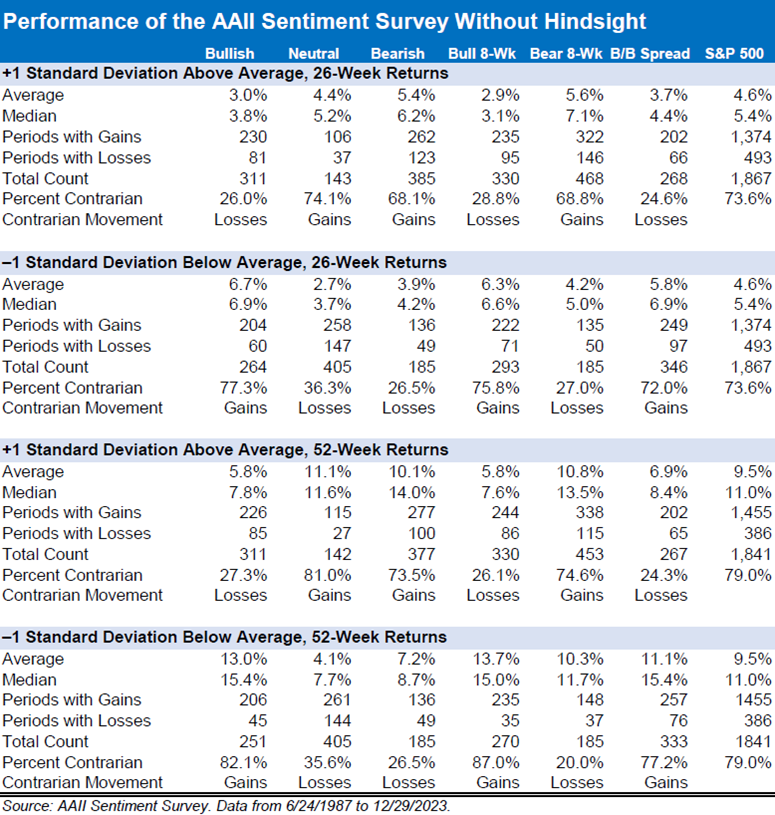
To put these numbers in context, the S&P 500 averaged a 4.6% gain over all six-month periods between June 1987 and December 2023. The median gain for the large-cap index was 5.4%.
Returns following unusually high bearish sentiment readings also slightly improved. The average return for the S&P 500 following unusually high pessimism is 5.4%. The median return is 6.2%. These numbers reflect small increases of 0.1 and 0.2 percentage points, respectively.
Last year, sentiment improved not only among individual investors but also among financial newsletter writers and fund managers. Slowing inflation and strong gains realized by the S&P 500 were both contributors.
Sentiment indicators are most useful as a prompt to look at the broader market. When bullish sentiment and/or the bull-bear spread are unusually low, ask what is occurring that would give investors reason to feel cautious. Similarly, when optimism is unusually high, ask what may be causing investors to be bullish.
The answers may reveal whether it makes sense to check your allocation to see if it is still approximately in line with your goals, if any presently held investments are meeting your sell rules or if there are opportunities that others may be overlooking. Most importantly, remember that successful investing requires both long-term focus and the ability to not react to short-term emotions.

-
Incorporating Investor Sentiment Into Your Portfolio Decisions
There is a long-running link between investor sentiment, like the AAII Sentiment Survey, reaching unusual levels and the market changing direction. -
Feature: Investor Sentiment as a Contrarian Indicator
Using AAII's Investor Sentiment Survey to forecast the direction of the market.
-
Even When Using a CPA, Taxpayers Must Ensure Their Returns Are Filed
It is the responsibility of the taxpayer to ensure their tax return has been filed, even when an accountant or other tax preparer is hired, ruled the U.S. Court of Appeals for the 11th Circuit.
AAII Sentiment Survey
Optimism among individual investors about the short-term outlook for stocks fell in the latest AAII Sentiment Survey. Meanwhile, neutral sentiment increased and pessimism decreased.
Bullish sentiment, expectations that stock prices will rise over the next six months, decreased 1.1 percentage points to 39.3%. Bullish sentiment is above its historical average of 37.5% for the 12th consecutive week.
Neutral sentiment, expectations that stock prices will stay essentially unchanged over the next six months, increased 1.8 percentage points to 34.6%. This is the highest reading since September 14, 2023 (36.4%). Neutral sentiment is above its historical average of 31.5% for the second time in eight weeks.
Bearish sentiment, expectations that stock prices will fall over the next six months, decreased 0.7 percentage points to 26.1%. Bearish sentiment is below its historical average of 31.0% for the 12th consecutive week.
The bull-bear spread (bullish minus bearish sentiment) decreased 0.4 percentage points to 13.2%. The bull-bear spread is above its historical average of 6.5% for the 12th consecutive week.
This week’s special question asked AAII members what information they are particularly paying attention to as companies are reporting fourth-quarter 2023 earnings.
Here is how they responded:
- Guidance on future revenues and earnings: 37.4%
- Whether earnings were better or worse than expected: 21.9%
- Sales and/or earnings growth: 19.9%
- Fundamentals such as the balance sheet or cash flow: 14.0%
- Other: 5.3%
Bullish: 39.3%, down 1.1 points
Neutral: 34.6%, up 1.8 points
Bearish: 26.1%, down 0.7 points
Bullish: 37.5%
Neutral: 31.5%
Bearish: 31.0%
See more Sentiment Survey results.

January 18, 2024 January Charts of Interest: Quality Boosts Returns
January 11, 2024 My Initial Observations on the New Spot Bitcoin ETFs
January 4, 2024 Where Market Indicators Stand as We Start 2024
December 28, 2023 AAII Members Expect Stocks to Rise and Bond Yields to Fall in 2024

Discussion
Barry from TX posted over 2 years ago:
Happy New Year, Charles. Thanks for compiling this data. As I understand the explanations in the text and the trends in data, AAII survey data does and/or does not indicate/predict/cause SPX changes or how AAIIers will use their sentiments to make portfolio allocations Thanks for making that clear. The disconnect between the Sentiment and Allocation surveys characterizes AIIers as true Thaler “humans.” So, is the AAII survey mostly a Keynesian beauty contest or an ongoing party game for seniors? That’s the survey question that matters.
Steve from IN posted over 2 years ago:
Part of the difference might be due to tax implications. Even when I feel negative on the market, many of my positions have a lot of unrealized capital gains and selling them would incur a large tax bill. I usually just ride it through the downturn if it happens.
You need to log in as a registered AAII user before commenting.
Create an account