

Where Market Indicators Stand as We Start 2024
by Charles Rotblut | January 04, 2024
Featured Tickers: AAPL
AMZN
GOOGL
META
MSFT
NVDA
TSLA
AAPL
AMZN
GOOGL
META
MSFT
NVDA
TSLA
Note: We are restarting our Educated Investor email series next Wednesday, January 10. It provides a curated listing of AAII articles on topics of interest to members. It also announces upcoming webinars and highlights AAII Community discussions. Make sure you are signed up to receive this weekly email by going to www.aaii.com/email.
We can trace the S&P 500’s big gain back to last March when two unrelated things happened. First, Silicon Valley Bank collapsed and was seized by regulators. Second, OpenAI released GPT-4. Combined, they revved up interest in growth stocks—especially technology-related growth stocks. This led to the stellar returns of the so-called Magnificent Seven stocks: Alphabet Inc.  (GOOGL), Amazon.com Inc. (AMZN), Apple Inc. (AAPL), Meta Platforms Inc. (META), Microsoft Corp. (MSFT), Nvidia Corp. (NVDA) and Tesla Inc. (TSLA).
 What will this year’s big catalyst be? Many people have thoughts, but it could well be something most aren’t currently talking about. I can tell you that there are two trends going in our favor: 1) The S&P 500 has historically risen during the fourth year of a president’s first term; 2) years with big gains are typically followed by years with more gains. To be fair, the S&P 500 has risen during far more calendar years than it has fallen.
Still, it is useful to occasionally take a step back and look at various market indicators to get a sense of where we are at as 2024 starts.
The Average Stock Lagged the S&P 500 in 2023—If your portfolio didn’t keep pace with the S&P 500, don’t feel bad. The Financial Times observed late last month that 72% of S&P 500 stocks were on track to underperform the S&P 500 for the full year. This was the highest percentage since at least 2000.
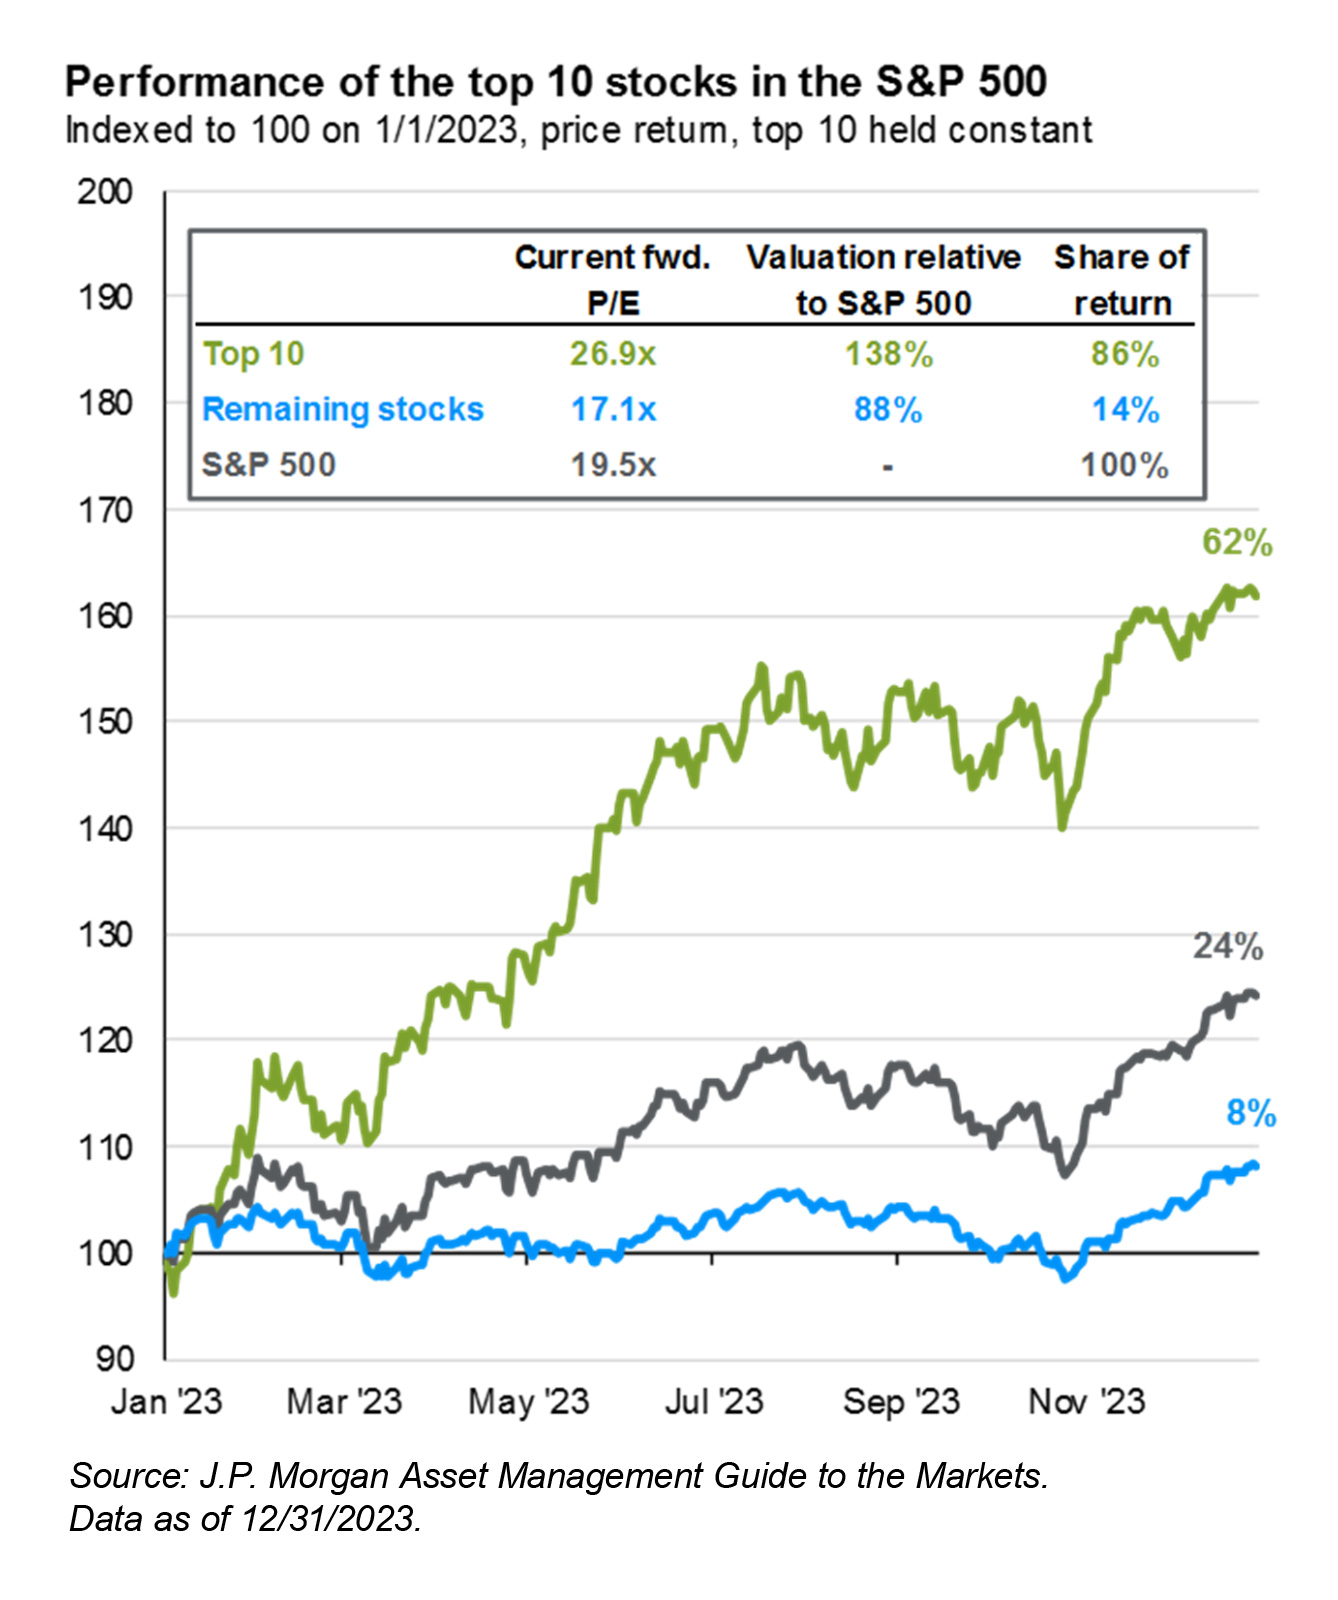
As I have previously pointed out, concentration in the S&P 500—which is a market-capitalization-weighted index—is extremely high. J.P. Morgan Asset Management says the 10 largest stocks accounted for nearly one-third (32.1%) of the index’s total market cap at year-end.
There Is Comparative Value in Value—Staying with data from J.P. Morgan Asset Management’s Guide to the Markets, small-cap value stocks ended 2023 with a price-earnings (P/E) ratio that was slightly below (2.6%) its 20-year average. Large-cap growth stocks ended 2023 trading at a 40.3% premium to their 20-year average price-earnings ratio. We at AAII have been noting the unusually large discount that S&P SmallCap 600 index stocks have been trading at relative to large-cap stocks on a price-to-book-value (P/B) basis.
The rubber band representing the relative historical valuations is very stretched. Could it have broken? Possibly. I personally think it will eventually snap back with a vengeance. The challenge with waiting for reversion to the mean (meaning a return to historical relationships) to occur is that it is not unusual for reversion to the mean to take longer to occur than many investors have the patience to wait. Those who do not anticipate it or think it won’t happen also get burned. Possible catalysts for small-cap stocks to take the lead are a decline in interest rates and a so-called economic soft landing.
Bond Yields Remain Inverted—Six-month Treasury bills yielded 5.26% at the end of December. The yield on the 10-year Treasury bond was 3.88%. This 138-basis-point difference is wider than we saw at the end of 2022. Inverted yield curves have historically preceded recessions. Plus, the Federal Reserve has a lousy record of achieving soft landings following interest-rate-tightening cycles.
Still, I’ll repeat what I wrote at the start of 2023: “It’s worth noting that there have been predictions of a recession occurring for many months now.” So, if we do get end up getting a recession sooner than later, it will be the most forecasted recession in history.
Earnings Expectations for 2024 Have Been Somewhat Steady—The LSEG I/B/E/S consensus estimate calls for S&P 500 earnings to grow by 11.1% in 2024. This forecast compares to 12.5% projected growth at the start of April 2023. Though down somewhat, it is nowhere near the downward revisions we saw analysts make in 2022 to their 2023 earnings forecasts.
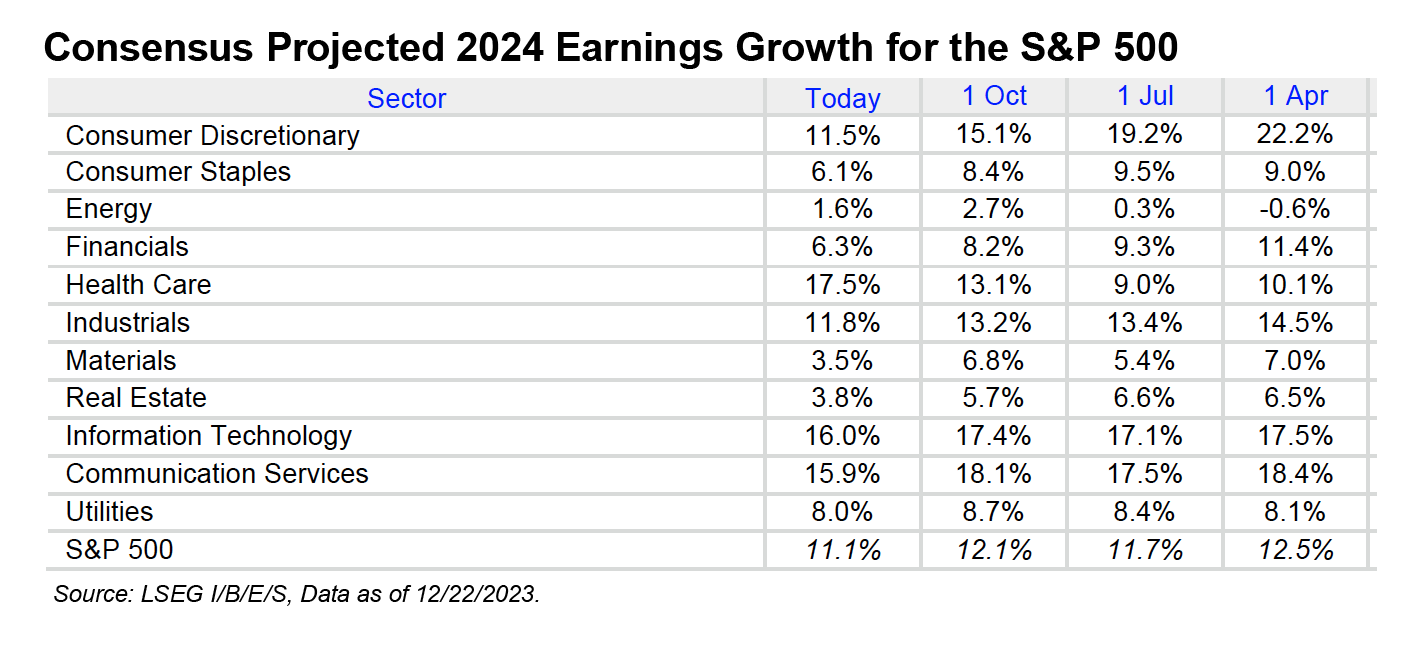
There are two big things to keep in mind when looking at the consensus estimate figures: Analysts routinely underestimate corporate earnings, and analysts’ forecasts become less accurate over longer periods.
The sector with the strongest projected growth is health care. Earnings for this sector are projected to rise 17.5% in 2024.
Inflation Has Slowed—The consumer price index (CPI) rose by 3.1% for the 12 months ending in November 2023. Though inflation remains above the Fed’s target of 2.0%, it is well below November 2022’s rate of 7.1%.
Monetary Policy Is Shifting—After raising interest rates aggressively in 2022, the Federal Open Market Committee (FOMC) only announced four quarter-point (0.25%) interest rate hikes in 2023. Furthermore, no rate hikes have been made since last July. This morning, the CME FedWatch Tool showed the federal fund futures market pricing in a 62% chance of an interest rate cut being announced at the FOMC’s March 2024 meeting. Expectations for the first interest rate cut have been premature so far, but monetary policy has been shifting toward neutral territory with loosening on the horizon.
Sentiment Is Ranging From Neutral to Hot—Bullish sentiment in our weekly AAII Sentiment Survey has stayed above 40% for nine consecutive weeks. It reached unusually high levels in December and is unusually high again this week. The Investors Intelligence Survey, which tracks the newsletter writers, is reportedly seeing few bears (17.2%). Bulls, at 57.1%, are on the higher side. Bank of America’s Bull & Bear Indicator is decidedly neutral at 5.0. This survey tracks sentiment among money managers. One year ago, all three signaled low levels of optimism.
Individual Investors Don’t Have to Worry About Shorter-Term Returns—One of the advantages of being an individual investor is not having to worry about what the financial markets are going to do in any given year. We can patiently wait out shorter-term downside volatility while pursuing our long-term goals (as long as shorter-term spending needs are covered). This makes forecasts and market commentary interesting but not necessary to our investing success.
Join us on Monday, January 8, at 2:00 p.m. Central Time for a live presentation on AAII’s Model Shadow Stock Portfolio. John Bajkowski will review the portfolio’s performance and discuss small-cap trends and insights during an interactive Q&A session. You can register here.

-
It’s Been Difficult for the Fed to Pull Off Economic Soft Landings
Most prior rate-hike cycles have been followed by recessions, so-called hard landings. Only one of the 11 previous rate-tightening cycles has resulted in a perfect soft landing. -
How to Analyze Earnings Surprises
An earnings surprise occurs when a company’s reported profits are above or below financial analysts’ expectations, which can change its share price. -
Shadow Stocks Ride the Refreshing “Everything” Rally
The Model Shadow Stock Portfolio was up 8.7% for the year through the end of November. Plus, the quarterly review prompted changes to the holdings. -
S&P 500 Stocks With the Potential to Outperform in 2024
Applying the characteristics of past top-performing stocks to the components of the S&P 500 index at the end of 2023. -
Adding a New Climate Leader and Evaluating My Net Worth
In her latest My Investing Discoveries blog post, Anine Sus makes some changes to her ETF portfolio and checks in on her current total net worth.
AAII Sentiment Survey
Optimism among individual investors about the short-term outlook for stocks increased in the latest AAII Sentiment Survey. Meanwhile, pessimism decreased, with neutral sentiment staying roughly flat.
Bullish sentiment, expectations that stock prices will rise over the next six months, increased 2.2 percentage points to 48.6%. Optimism’s rise moved it back to an unusually high level. Bullish sentiment is above its historical average of 37.5% for the ninth consecutive week and the 10th time in 13 weeks.
Neutral sentiment, expectations that stock prices will stay essentially unchanged over the next six months, decreased 0.7 percentage points to 27.9%. Neutral sentiment is below its historical average of 31.5% for the fifth consecutive week and the 13th time in 14 weeks.
Bearish sentiment, expectations that stock prices will fall over the next six months, decreased 1.6 percentage points to 23.5%. Bearish sentiment is below its historical average of 31.0% for the ninth consecutive week.
The bull-bear spread (bullish minus bearish sentiment) increased 3.8 percentage points to 25.1%. The bull-bear spread is above its historical average of 6.5% for the ninth consecutive week and the 10th time in 18 weeks.
This week’s special question asked AAII members what they think about the rebound in bitcoin and other cryptocurrencies.
Here is how they responded:
- It’s a return of a speculative bubble: 46.8%
- It reflects optimism of a bitcoin exchange-traded fund (ETF) being approved: 22.5%
- Bitcoin and other cryptocurrencies were previously undervalued: 3.0%
- Not sure/no opinion: 27.4%
Bullish: 48.6%, up 2.2 points
Neutral: 27.9%, down 0.7 points
Bearish: 23.5%, down 1.6 points
Bullish: 37.5%
Neutral: 31.5%
Bearish: 31.0%
See more Sentiment Survey results.

AAII Asset Allocation Survey
Individual investors’ allocation to equities increased in the December Asset Allocation Survey.
Stock and stock fund allocations increased 1.8 percentage points to 66.4%. Stock and stock fund allocations are above their historical average of 61.5% for the 43rd consecutive month.
Bond and bond fund allocations decreased 0.1 percentage points to 16.3%. Bond and bond fund allocations are above their historical average of 16.0% for the second time in 34 months.
Cash allocations decreased 1.7 percentage points to 17.3%. Cash allocations are below their historical average of 22.5% for the 13th consecutive month.
Optimism and pessimism in the weekly AAII Sentiment Survey moved back into their respective typical ranges at the end of December.
- Stocks and Stock Funds: 66.4%, up 1.7 percentage points
- Bonds and Bond Funds: 16.3%, down 0.1 percentage points
- Cash: 17.3%, down 1.6 percentage points
- Stocks: 30.7%, up 0.9 percentage points
- Stocks Funds: 35.7%, up 0.8 percentage points
- Bonds: 5.3%, down 0.5 percentage points
- Bond Funds: 11.0%, up 0.4 percentage points
- Stocks/Stock Funds: 62.0%
- Bonds/Bond Funds: 16.0%
- Cash: 22.0%
Take the Asset Allocation Survey.
December 28, 2023 AAII Members Expect Stocks to Rise and Bond Yields to Fall in 2024
December 21, 2023 December Charts of Interest: Stocks Are Overbought
December 14, 2023 How Inflation Expectations and Bond Yields Have Changed
December 7, 2023 Four Strategies for Reducing Capital Gains Taxes on Investments

Discussion
KMM from Ohio posted over 2 years ago:
"The yield on the 10-year Treasury bond was 3.88%" Question - how is the 3.88% calculated? What factors all go into it - how many 10 year notes over time? or what the expected next auction will yield? or ?? I am trying to understand the "math behind the number". The reason that I ask this question is 1) I could buy a 10 year Treasury Note with a coupon rate of 4.50%, and a Yielding rate of about 4.29% back on December 10th. 2) If I buy the next 10 year auction on January 10th - I assume the same range. 3) but I always see the 10 Year Yield "benchmark" is below the above yield percentages. So - how is the 3.88% calculated. Is that based on a future expected bond auction? if yes - what time frame in the future for the 10 year auction. or is the 3.88% based on something else.
Barry from TX posted over 2 years ago:
Charles, your data density is increasing. Thanks for the research. The overarching trend appears to be that the Wall of Worry is still there and 2024 will add more bricks. #1 The JPM graph says a lot about buying opportunities that a 2024 market reversion to the mean foreshadows. M7/Top 10 mean fP/E could drop from 62% to 24%. For NVDA that’s 187 points and AMZN 50 points. That would be a good time to BTD. The “other 490” current fP/E can grow 200% (triple!) to get to the mean. I’d settle for just half of that upside. I would double the current prices. But average P/Es could shrink those gaps as analyst expectations change. #2 The sector forecasts in the LSEG table show 2 up (18%) and 9 down (82%). The 2 up a little are HC +7, NRG +2. The 6 down a little are UTL 0, IND -1, IT -1, COM -2, RE -2; CS -3; and the other 2 are down 50% (MAT -4, CD -11, FIN -5. Overall SPX is down -1. #3 The inverted yield curve is widening. Historically, inverted yield curves have preceded recessions by 6 to 11 months on average. We are near the top end of that range now. The glide path for a soft landing has come and the runway is getting shorter. It is never a good thing to run out of runway. As Ben Graham, Buffett, and others say, this could be a great buying time. Buy the "other 490" now, the M7/Top10 later. #4 On the probability of a recession: In 1982 (late during a lengthy Fed rate cycle similar to 2023-2024) Paul Samuelson said, “The stock market has predicted 9 out of the last 5 recessions.” In 2024, that can now be updated to 13 out of the last 7. As Ben Graham, Buffett, and others say, this could be a great time to buy. #5 The current AAII survey says AAIIers hold 17% cash and have 83% AUM invested. I hope that's in small-cap value stocks.
Steve from IN posted over 2 years ago:
That performance chart of the top 10 versus the rest is still crazy even though people have been talking about it for a while. I consider myself quite lucky to have owned 2 of them for a while as it has really helped my portfolio overall.
Charles Rotblut from Illinois posted over 2 years ago:
Hi KMM,
I used the daily Treasury par yield curve rates that the Treasury Department publishes.
-Charles
You need to log in as a registered AAII user before commenting.
Create an account