

How Inflation Expectations and Bond Yields Have Changed
by Charles Rotblut | December 14, 2023
Special note: You can help build generational wealth this holiday season with AAII gift membership. By taking advantage of this special holiday offer, you’ll be planting seeds of financial wisdom that will flourish throughout your loved ones’ lives. It’s an opportunity to start conversations about investing, to inspire and to educate—a true legacy of financial education. Call 312-847-3242 or click here to gift.
A lowering of expectations for future inflation is contributing to the likelihood of the Federal Reserve either being at the end or very close to the end of its current interest rate tightening cycle. This trend can be seen in both the five- and 10-year breakeven inflation rates. The breakeven rates signal what bond market participants expect inflation will be in the next five and 10 years.
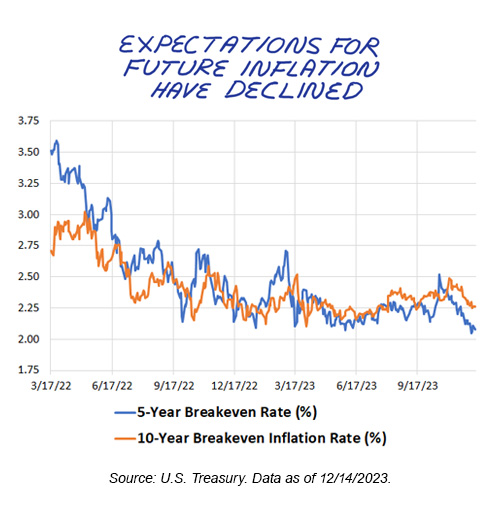
Though the data is noisy, both breakeven rates have trended significantly downward since the Federal Open Market Committee (FOMC) first started raising rates in March 2022. The five-year rate is approaching the Fed’s target of 2% inflation while the 10-year breakeven rate is not much higher than it.
I like looking at the breakeven rates because they reflect actual market expectations. They are derived from bonds as opposed to economic forecasts. Of course—just like any other indicator—they are very much subject to error and change.
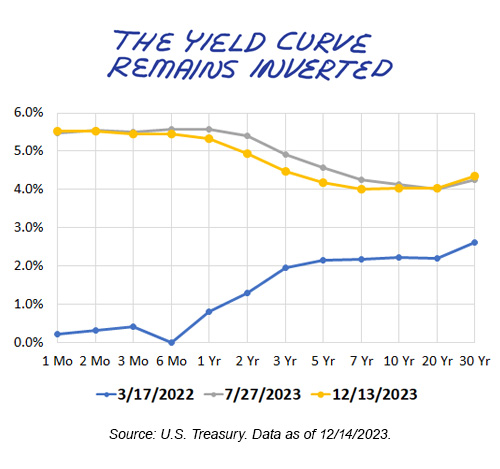
Another metric I keep an eye on is the yield curve. This plots the comparative yields of Treasurys with various maturities. At the time of the first interest rate hike in March 2022, the yield curve was upward sloping. Longer-term Treasurys had higher yields than shorter-term Treasurys. The yield curve has since inverted. It was already inverted at the time of the last rate hike (July 27, 2023) and remains inverted now. An inverted yield curve occurs when shorter-term Treasurys are yielding more than longer-term Treasurys.
Historically, when the three-year Treasury note has yielded more than the 10-year Treasury bond, recessions have followed, according to Duke University professor Campbell Harvey. Recessions/significant economic slowdowns have followed most prior interest rate tightening cycles as well. Whether the Fed will be able to achieve an elusive soft landing this time remains to be seen.
Part of the reason for the current yield curve inversion is the pressure interest rate hikes have put on the shorter end of the yield curve. Meanwhile, longer-term inflation expectations never experienced as severe a surge as the reported level of inflation did. Market forces also played a role in determining the shape of the yield curve—as they always do.
The ongoing inverted yield curve continues to provide opportunities for savers. Discover is currently offering AAII members 12-month certificates of deposit (CDs) yielding 5.25% and savings accounts yielding 4.40%. There are other banks and firms also offering competitive rates. Even one-year Treasury bills were yielding 4.94% as of Wednesday’s close. (You can purchase those directly from the Department of the Treasury at TreasuryDirect.gov.)
While these yields are juicy, they come with no capital appreciation. When the Fed finally begins cutting interest rates, these yields will come down. Just like it is extraordinarily difficult to time the stock market, it is also extraordinarily difficult to time when you should rotate out of cash and back into stocks. This is why it continues to make sense to allocate funds needed for long-term growth to stocks and not to cash.
As far as cash is concerned, shop around if your bank isn’t offering competitive rates. The national average for one-year CDs is just 1.73% according to Bankrate.com. Many CDs and savings accounts are paying paltry interest rates. While we can’t predict where interest rates will be one year from now, we can say that there are still opportunities to add a little extra jingle to your wallet.

-
Online Exclusive: Understanding the Breakeven Inflation Rate
The breakeven inflation rate is a helpful guide for determining minimal rates of return required to maintain wealth in real terms. -
Bond Yields’ Role as a Recession Warning Signal
When the yield curve gets inverted, it precedes economic downturns and recessions. -
Tax-Savvy Strategies for Your Stocks, Mutual Funds and ETFs
Savvy steps to avoid or limit the tax impact of security events, and tools on AAII.com you can use to help manage them. -
The Individual Investor’s Guide to Personal Tax Planning 2023
In addition to large inflation adjustments being made for a second consecutive year, several changes related to the SECURE 2.0 Act will go into effect. -
The Year of Financial Thinking: 2023 in Review
In her last My Investing Discoveries blog post of 2023, Anine Sus reflects on what surprised her about her finances this year and how her relationship to money has changed.
Members are looking for your input. Can you help with this question from the Options Investing Strategies Community?
“Can seasonal patterns in consumer behavior provide insights for options investing strategies, and if so, how do you incorporate them?”
Tap the button and then choose the Join the Community button on the right to answer this question in the AAII Community
Answer This Question in the AAII Community »
AAII Sentiment Survey
Optimism among individual investors about the short-term outlook for stocks rose to its highest level in nearly five months in the latest AAII Sentiment Survey. Meanwhile, pessimism fell to its lowest level in almost six years.
Bullish sentiment, expectations that stock prices will rise over the next six months, increased 4.0 percentage points to 51.3%. Optimism is now unusually high, at its highest level since July 20, 2023 (51.4%). Bullish sentiment is above its historical average of 37.5% for the sixth consecutive week and the seventh time in 10 weeks.
Neutral sentiment, expectations that stock prices will stay essentially unchanged over the next six months, increased 4.1 percentage points to 29.4%. Neutral sentiment is below its historical average of 31.5% for the 10th time in 11 weeks.
Bearish sentiment, expectations that stock prices will fall over the next six months, decreased 8.1 percentage points to 19.3%. Pessimism is unusually low, at its lowest level since January 3, 2018 (15.6%). Bearish sentiment is below its historical average of 31.0% for the sixth consecutive week and the sixth time in 13 weeks.
The bull-bear spread (bullish minus bearish sentiment) increased 12.1 percentage points to 32.0%. The bull-bear spread is above its historical average of 6.5% for the sixth time in 14 weeks.
This week’s special question asked AAII members how they would describe the current valuation of stocks.
Here is how they responded:
- Valuations are mixed, with some stocks expensive and others cheap: 42.3%
- Stocks, in general, are overvalued: 29.4%
- Stocks, in general, are fairly valued: 16.4%
- Stocks, in general, are undervalued: 5.8%
- Not sure/no opinion: 5.8%
Bullish: 51.3%, up 4.0 points
Neutral: 29.4%, up 4.1 points
Bearish: 19.3%, down 8.1 points
Bullish: 37.5%
Neutral: 31.5%
Bearish: 31.0%
See more Sentiment Survey results.

December 7, 2023 Four Strategies for Reducing Capital Gains Taxes on Investments
November 30, 2023 Remembering Charlie Munger
November 23, 2023 Seven Reasons for Investors to Be Grateful in 2023
November 16, 2023 November Charts of Interest: Small-Cap Pain

Discussion
No comments have been added yet. Add your thoughts to the discussion!
You need to log in as a registered AAII user before commenting.
Create an account