

November Charts of Interest: Small-Cap Pain
by Charles Rotblut | November 16, 2023
Featured Tickers: AMZN
IVV
IWM
WMT
AMZN
IVV
IWM
WMT
Though I typically start my monthly charts of interest commentary with charts created by others, I’m pivoting this month and going with one I put together first. Call it editor’s choice.
Small-cap stocks have yet to sustain a breakout from their last bear market. Though the Russell 2000 index rose more than 20% above last year’s low—the threshold for ending a bear market—over the summer, it has since reversed course. Late last month, the index neared its bear market lows.
The chart below uses the iShares Russell 2000 ETF  (IWM) as a proxy for the Russell 2000. The other exchange-traded fund (ETF), the iShares Core S&P 500 ETF (IVV), is a proxy for the S&P 500 index. The difference between the two since March is stark.
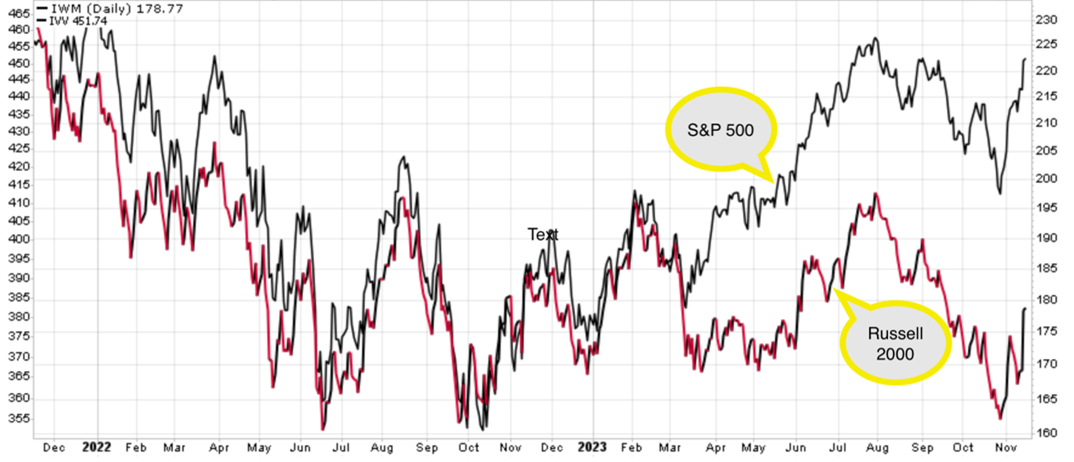
Source: StockCharts. Data as of 11/15/2023.
Interest rates are playing a role. As the bond market went a bit bonkers a few weeks ago, small-cap stocks acted as if they took a hard punch to the jaw. Small companies tend to be riskier than their larger counterparts.
They Are Cheap Though
I’ve written before about how small-cap stocks are cheap relative to large-cap stocks. This continues to be the case. As of the end of October, the median price-to-book-value (P/B) ratio for S&P SmallCap 600 index stocks was 1.52. Meanwhile, the median price-to-book ratio for S&P 500 stocks was 3.01. This continues the ongoing historically wide valuation difference between the two.
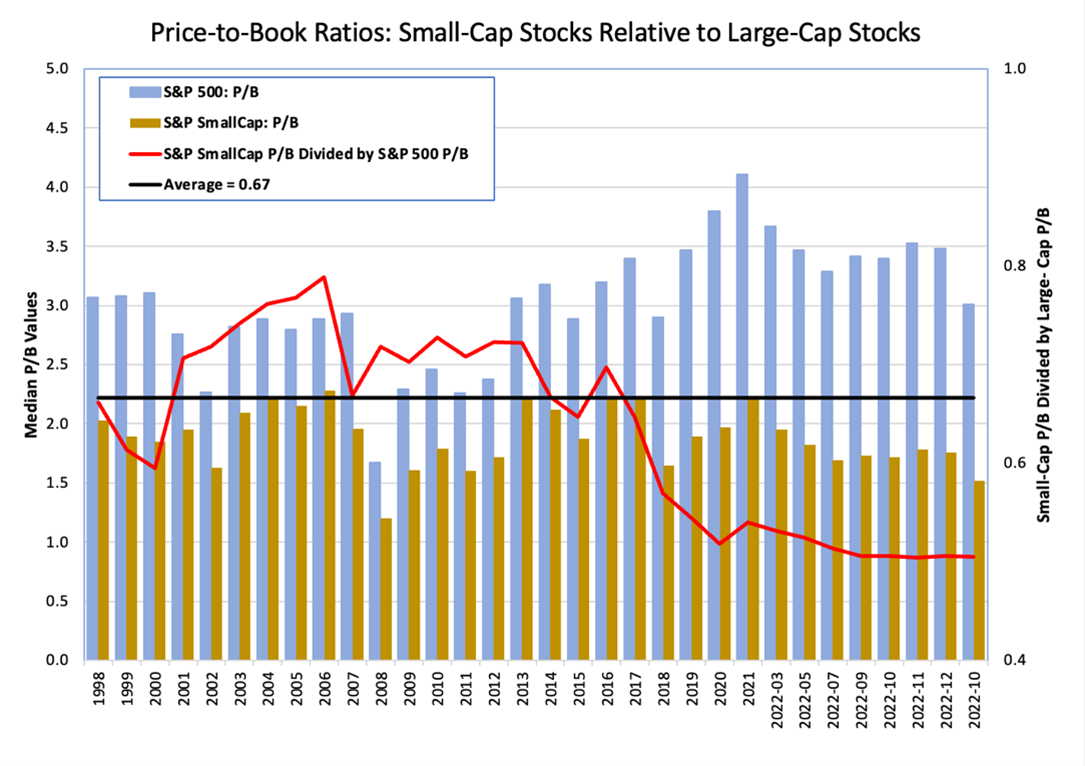
Source: LSEG and AAII. Data as of 10/31/2023.
The U.S. Is on Quite a Streak
Among the big arguments for diversification is that not all investments perform the same, even within asset classes. Such is the case for domestic and foreign stocks. U.S. stocks have delivered higher returns than their international counterparts for 12.6 years. This streak compares to the historical average of eight years, according to Hartford Funds.
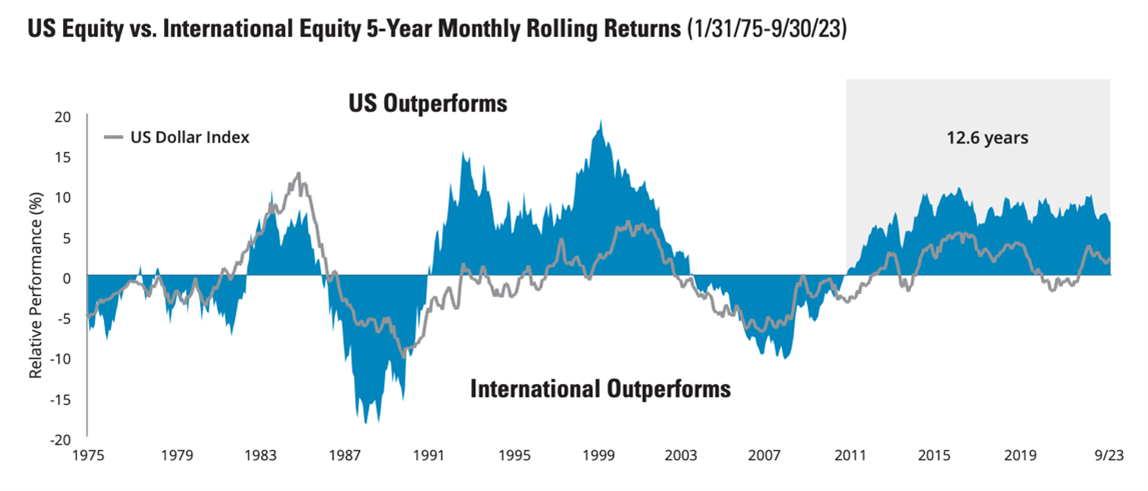
Source: Hartford Funds. Data as of 9/30/2023.
How Dare You Miss!
Third-quarter earnings season has been good on the earnings surprise front. As of last week, more than four-fifths (81%) of S&P 500 companies reported earnings that topped analysts’ expectations.
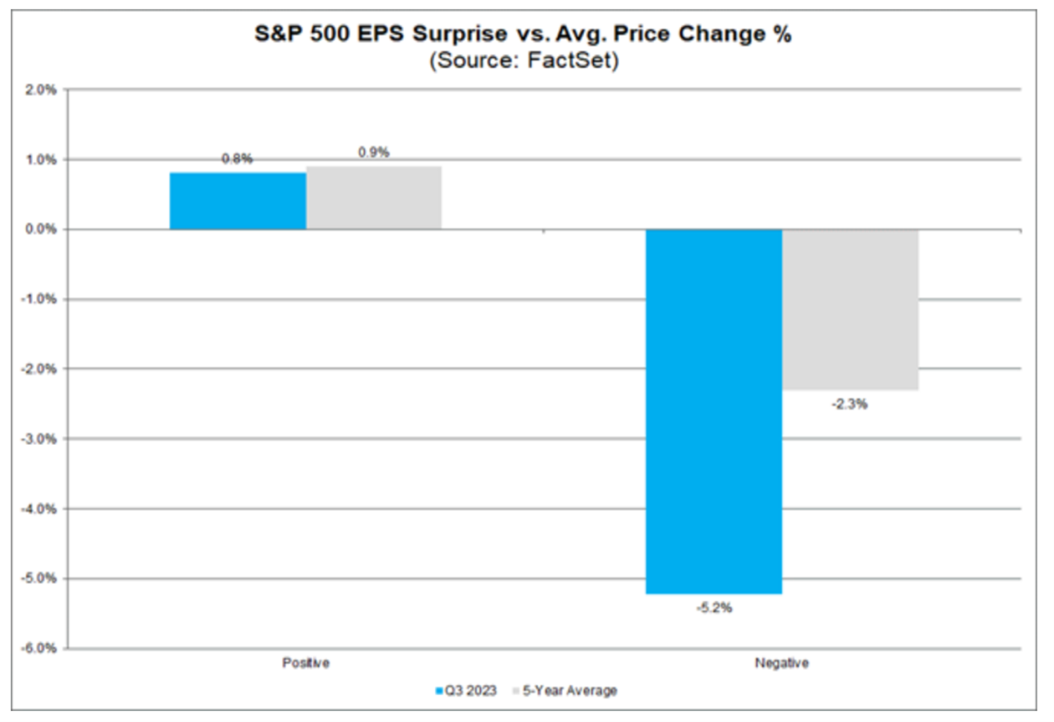
However, approximately 9% have missed expectations. Traders have not reacted kindly. Those stocks have experienced an average price decrease of 5.2% during the period starting two days before the earnings release and ending two days after the earnings release. FactSet says this is not only greater than the average price decrease of 2.3%, but it is on pace to be “the largest average negative price reaction to negative [earnings] surprises reported by S&P 500 companies for a quarter since [second-quarter] 2011 (–8.0%).”
Talk About a Tough Crowd …
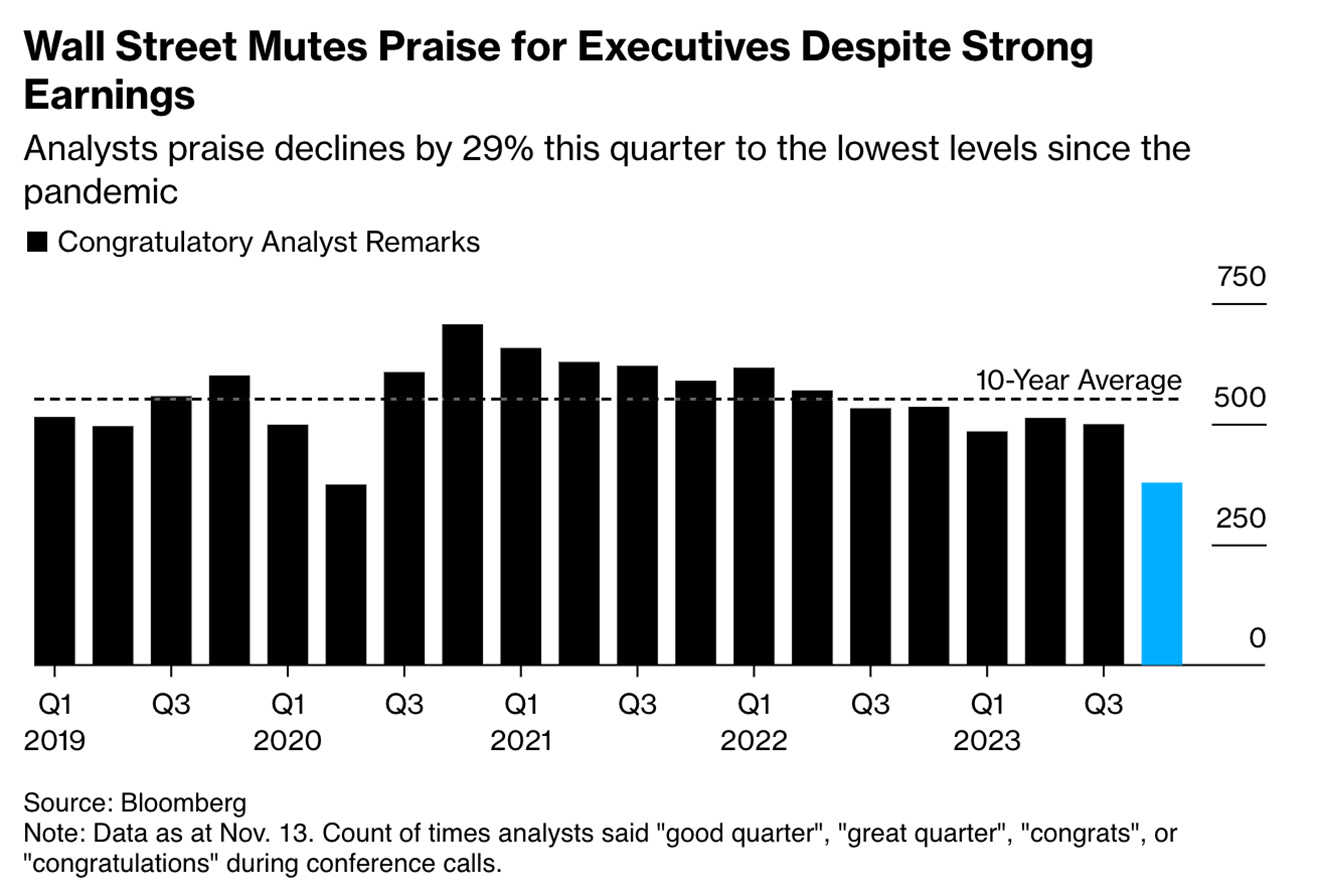
Among the things analysts are cutting back on is their plaudits, reports Bloomberg. The amount of verbal praise given during third-quarter conference calls is running 35% below the average of the past three years. “Even when the numbers are good, analysts may refrain from compliments when the economic backdrop appears to be deteriorating,” suggests Bloomberg.
Bonds Are Back?
One argument being made is that bonds are currently attractive. This is largely based on the premise that real (inflation-adjusted) yields are positive for the first time in many years, as this chart from Research Affiliates shows. Even in the bond market, pundits and strategists operate with cracked crystal balls, so there is no telling how bonds will actually fare in the future.
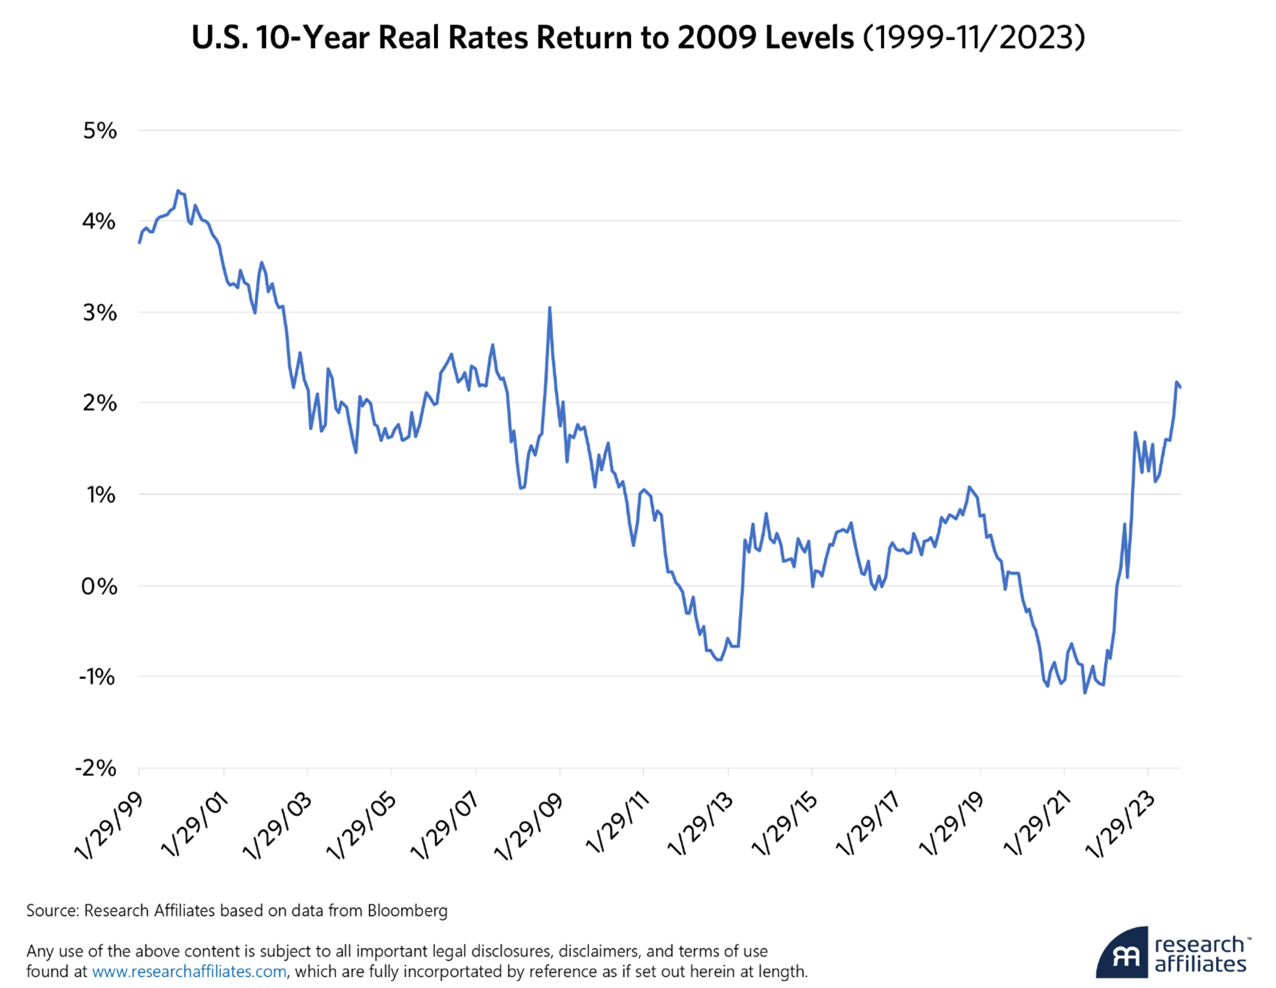
If interest rates have peaked, then bonds could have the potential to realize capital gains going forward—unlike certificates of deposit (CDs) and money market accounts. We still think bonds should be considered within the confines of your tolerance for volatility and allocation needs. While bonds provide income and preservation of capital, stocks provide much more capital growth, albeit with greater short-term volatility.
More Than Just Books
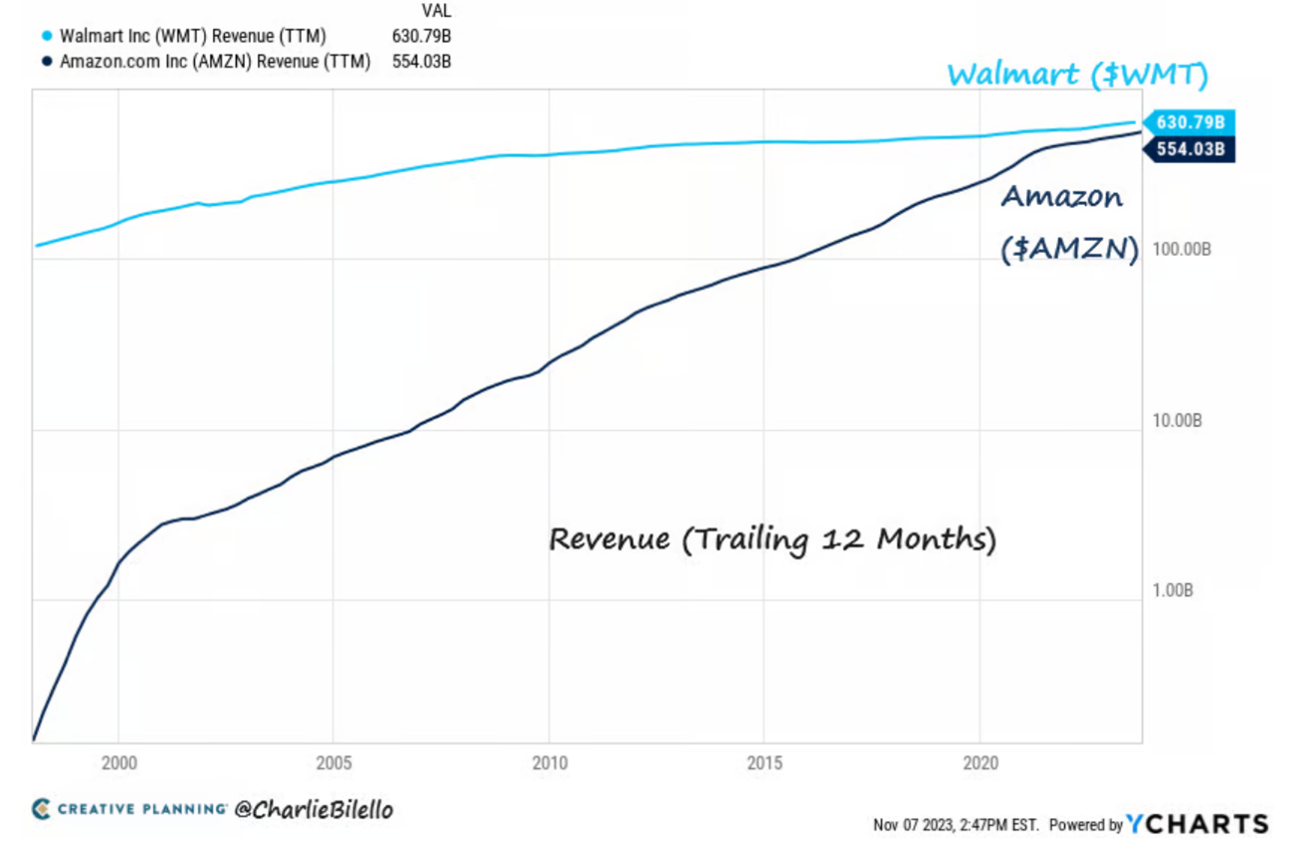
Finally, Amazon is closing in on Walmart in terms of revenues. The difference has narrowed from Walmart having 2.0 times as much revenue five years ago to just 1.1 times more revenue now, according to Charlie Bilello. Amazon Inc. (AMZN) has more sources of revenue than Walmart Inc. (WMT), so it’s not an apples-to-apples comparison (even though both sell apples and Apple products). Still, it just shows how big Amazon has become.
Now, if you will excuse me, I think someone just left a package at my front door …

-
The Benefits and Risks of Small-Cap Funds
Because small caps make up only one part of a diversified approach to asset allocation, consider your tolerance for risk when deciding how much exposure to them you want. -
How to Analyze Earnings Surprises
An earnings surprise occurs when a company’s reported profits are above or below financial analysts’ expectations, which can change its share price. -
A Case Study: How to Reduce Marginal Tax Rates in Retirement
Combining an optimal Social Security claiming strategy with a multiphase withdrawal strategy that exploits the rising and falling pattern of marginal tax rates can add substantial value to a retirement portfolio. -
Holiday Preview: Stocks That May Benefit From Seasonal Spending
Companies that might benefit from approaching holiday spending include well-known companies and many that are the largest in their respective industries. -
A Look at Top Gender Equality Funds
In her latest My Investing Discoveries blog post, Anine Sus looks at sustainable funds with the best gender equality grades.
Members are looking for your input. Can you help with this question from the Income Investing Community?
“Brian Haughey uses the dividend discount model to value stocks in his recent AAII Journal article. Given the challenges in accurately forecasting dividend growth rates, how do you approach their estimation? Do you consider market and economic factors that might impact dividend outcomes?”
Tap the button and then choose the Join the Community button on the right to answer this question in the AAII Community
Answer This Question in the AAII Community »
AAII Sentiment Survey
Optimism among individual investors about the short-term outlook for stocks continued to rise in the latest AAII Sentiment Survey. Meanwhile, pessimism slightly increased.
Bullish sentiment, expectations that stock prices will rise over the next six months, increased 1.2 percentage points to 43.8%. Optimism is above its historical average of 37.5% for the fourth time in 14 weeks.
Neutral sentiment, expectations that stock prices will stay essentially unchanged over the next six months, decreased 2.1 percentage points to 28.1%. Neutral sentiment is below its historical average of 31.5% for the eighth time in 11 weeks.
Bearish sentiment, expectations that stock prices will fall over the next six months, increased 0.9 percentage points to 28.1%. Pessimism is below its historical average of 31.0% for the fourth time in 11 weeks.
The bull-bear spread (bullish minus bearish sentiment) increased 0.3 percentage points to 15.7%. The bull-bear spread is above its historical average of 6.4% for the third time in 11 weeks.
This week’s special question asked AAII members what their perception was of third-quarter earnings. Here are the responses:
- They approximately matched my expectations: 47.5%
- They were better than I expected: 29.3%
- They were worse than I expected: 6.0%
- Not sure/No opinion: 17.0%
Bullish: 43.8%, up 1.2 points
Neutral: 28.1%, down 2.1 points
Bearish: 28.1%, up 0.9 points
Bullish: 37.5%
Neutral: 31.5%
Bearish: 31.0%
See more Sentiment Survey results.

November 9, 2023 Dealing With Shades of Gray in My Allocation
November 2, 2023 Cash Is Popular, but Be Careful When Allocating to It
October 26, 2023 Expanding Upon the 10 Commandments of Investing
October 19, 2023 October Charts of Interest: Soaring Bond Yields and Falling Bond Prices

Discussion
Robert Rhodes from TX posted over 2 years ago:
I dipped my toes into the individual bond market after the 2007/2008 market blowup, and I was rewarded handsomely. My bond shop, yes, I used a full-service bond trader (John Bott at Tri-Star, since deceased) bought broken bonds (bonds that were broken due to the mortgage crash). A $100,000 investment turned into $400,000 plus over the 15 years since. So, I bought into a muni-bond fund called with that same $100,000. The fund (HICOX) is top notch, low expenses, long term management and a steady market. Everything was great, except... They were A shares - 4.5% went away day 1 on buy. OK, I can deal with that for the quality. Then interest rates went up, and as it should, the fund share price lost due to the discount applied to the bonds. So, after almost 19 months, the original $100,000 was just over $95,000 - in safe muni's. Moral of the story, bonds aren't any safer than stocks and especially the funds themselves. Buying the muni's directly would have been better (no loss for up front fees nor drop in share price), but then there is illiquidity.
Rob from NC posted over 2 years ago:
"Among the big arguments for diversification is that not all investments perform the same, even within asset classes." That's exactly why "rebalancing" is usually counterproductive.
You need to log in as a registered AAII user before commenting.
Create an account