

January Charts of Interest: Quality Boosts Returns
by Charles Rotblut | January 18, 2024
I saw many people posting charts about the 2023 year-end rally as I was perusing ideas for this month’s charts of interest. I discuss how the rally has impacted sentiment, but first I want to focus on something that could have a much bigger benefit for your portfolio: the quality factor.
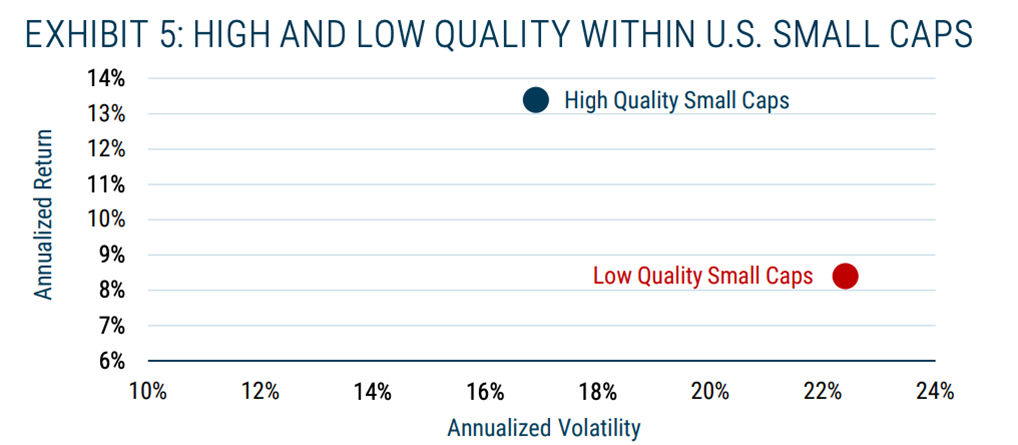
Ben Inker of asset management firm GMO found that requiring quality boosts the returns of most types of stocks, including small-cap stocks, as well as bonds. Though investors typically get rewarded for taking risks, seeking fundamental strength instead of fundamental weakness provides more bang for dollars invested.
“In an investing world where most trade-offs are difficult, this one is pretty easy. If you were going to have one permanent bias in your equity and high-yield bond portfolios, it should be in favor of high quality,” writes Inker.
(Note: AAII’s Model Shadow Stock Portfolio incorporates the quality factor by requiring that all holdings are profitable.)
Source: GMO, Worldscope and Compustat. Data from 1983–2023.
More Evidence of How Relatively Cheap Small-Cap Stocks Are
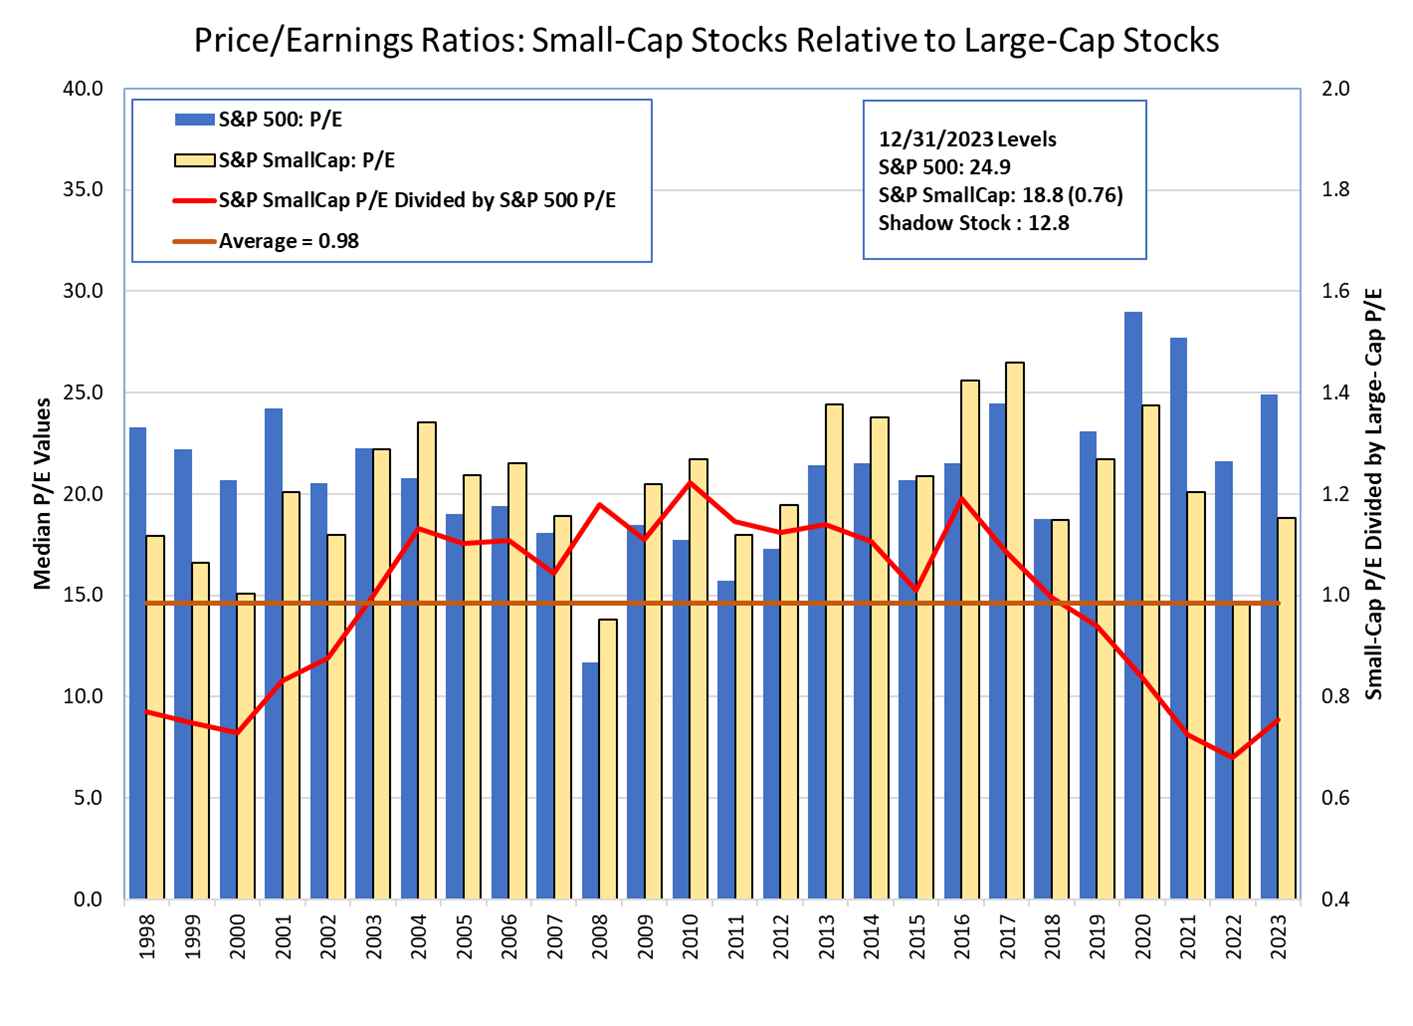
We’ve published charts before showing how small-cap stocks are trading at historically low price-to-book-value (P/B) ratios relative to large-cap stocks. AAII president John Bajkowski recently redid the analysis using the price-earnings (P/E) ratio and data from LSEG I/B/E/S.
Historically, small-cap stocks’ price-earnings ratios have averaged 98% of large-cap stocks’ price-earnings valuations. As of the end of 2023, small-cap stocks were trading at just 76% of large-cap stocks’ valuations. This further lends support to the notion that small-cap stocks are due for a period of outperformance as long as the long-term historical relationships have not broken.
Source: AAII.
Most Large-Cap Stocks Underperformed in 2023 …
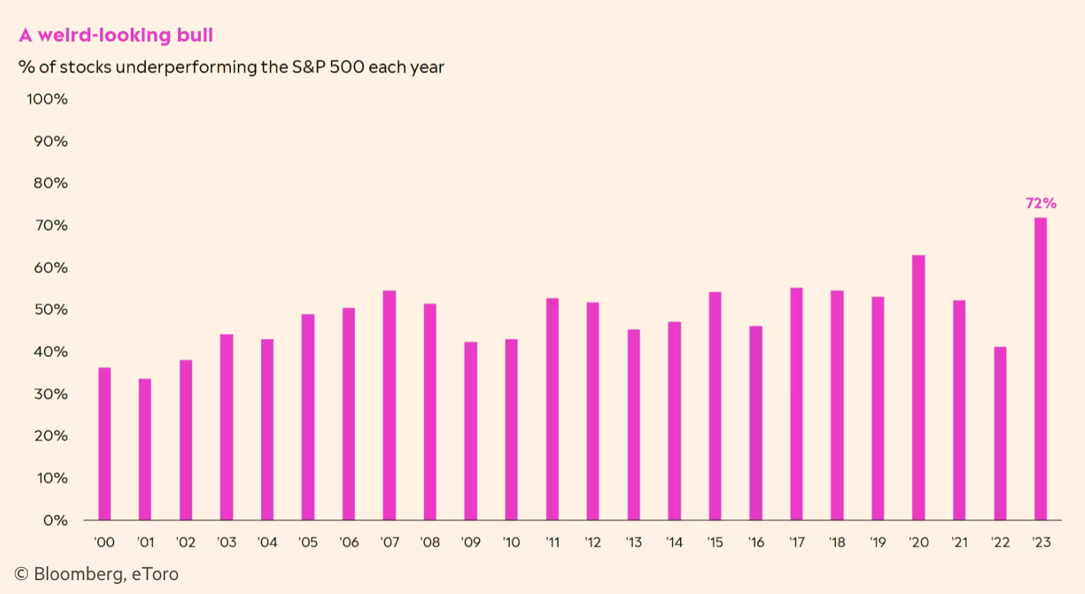
I mentioned a few weeks ago that nearly three-quarters (72%) of S&P 500 index member stocks were on track to underperform the S&P 500 for the full year near the end of 2023. Below is a chart showing just how proportionately high this underperformance is relative to previous years.
Callie Cox, the U.S. investment analyst at eToro, blames high interest rates. Cox believes that because there is less money floating around and borrowing is more expensive, many people are being more selective about what stocks they are buying.
… Yet Optimism has Jumped
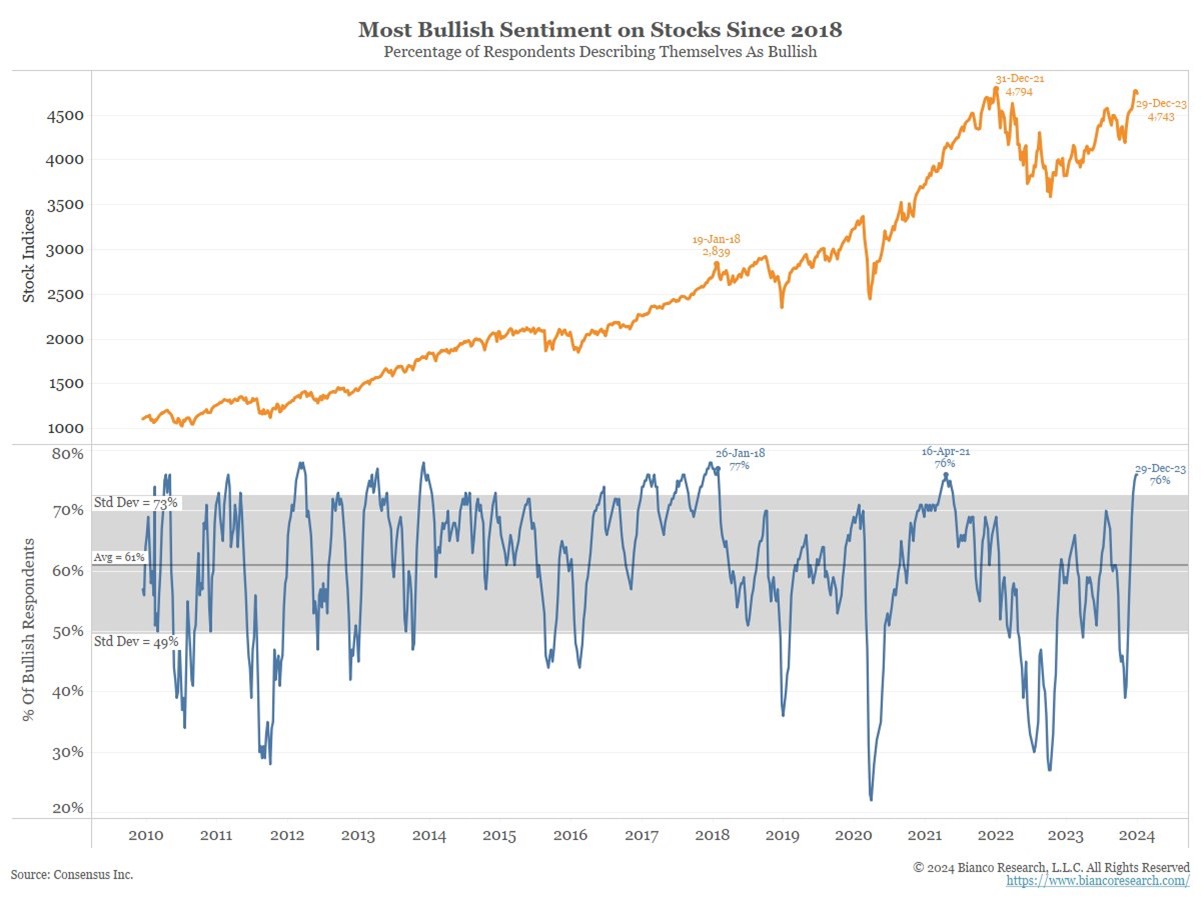
The 2023 year-end rally resulted in a boost of optimism—and not just among AAII members either. Research firm Consensus Inc. found that futures market newsletters and brokerage reports are much more upbeat about the prospects for stocks.
Jim Bianco of Bianco Research says this is the “most bullish reading on stocks in six years” shown in Consensus’ analysis.
Inflation Is Still Above the Federal Reserve’s Target
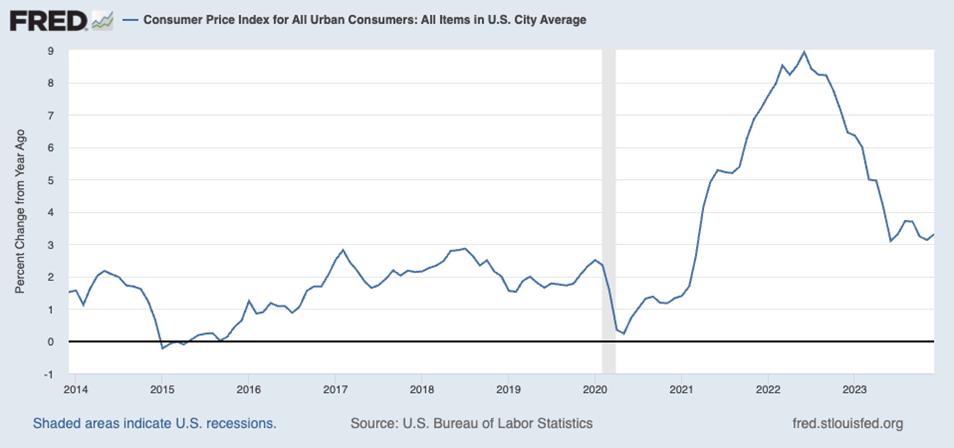
A big positive for consumers last year was the falling rate of inflation. December’s consumer price index (CPI) showed prices rising at a 3.4% rate in 2023. The clear change in trend we’ve seen is good, but not everyone is convinced that it’s good enough. Last week, the Federal Reserve Bank of Cleveland president and CEO Loretta Mester told Bloomberg TV that “there is more work to do.”
We’ll note that Mester, who is currently a voting member of the Federal Open Market Committee (FOMC), will retire this summer.
Lots of Eyes on Monetary Policy
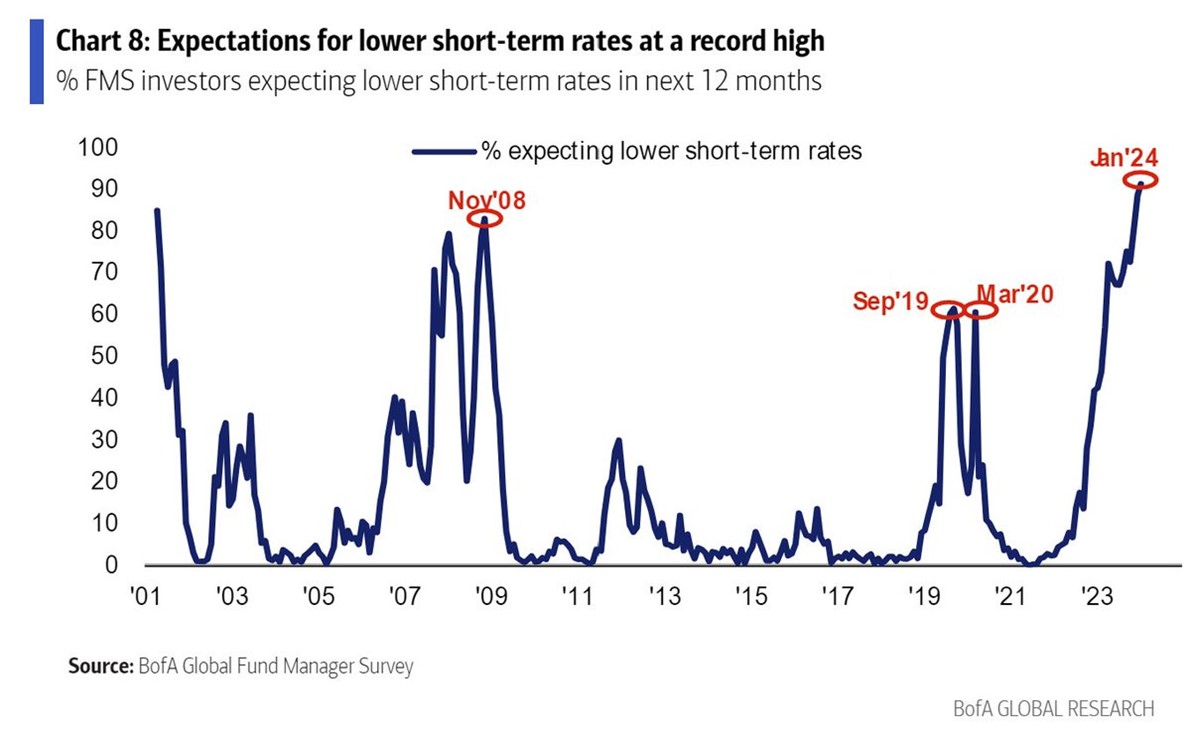
Slightly more than half of fund managers surveyed by Bank of America Global Research think monetary policy will have the largest impact on stock prices. Most (91%) of these managers expect the Fed to cut interest rates this year, according to Callum Thomas at Topdown Charts.
I’ll add that what actually drives stock prices is often not what people expect in advance.
What Experts Think Could Go Wrong
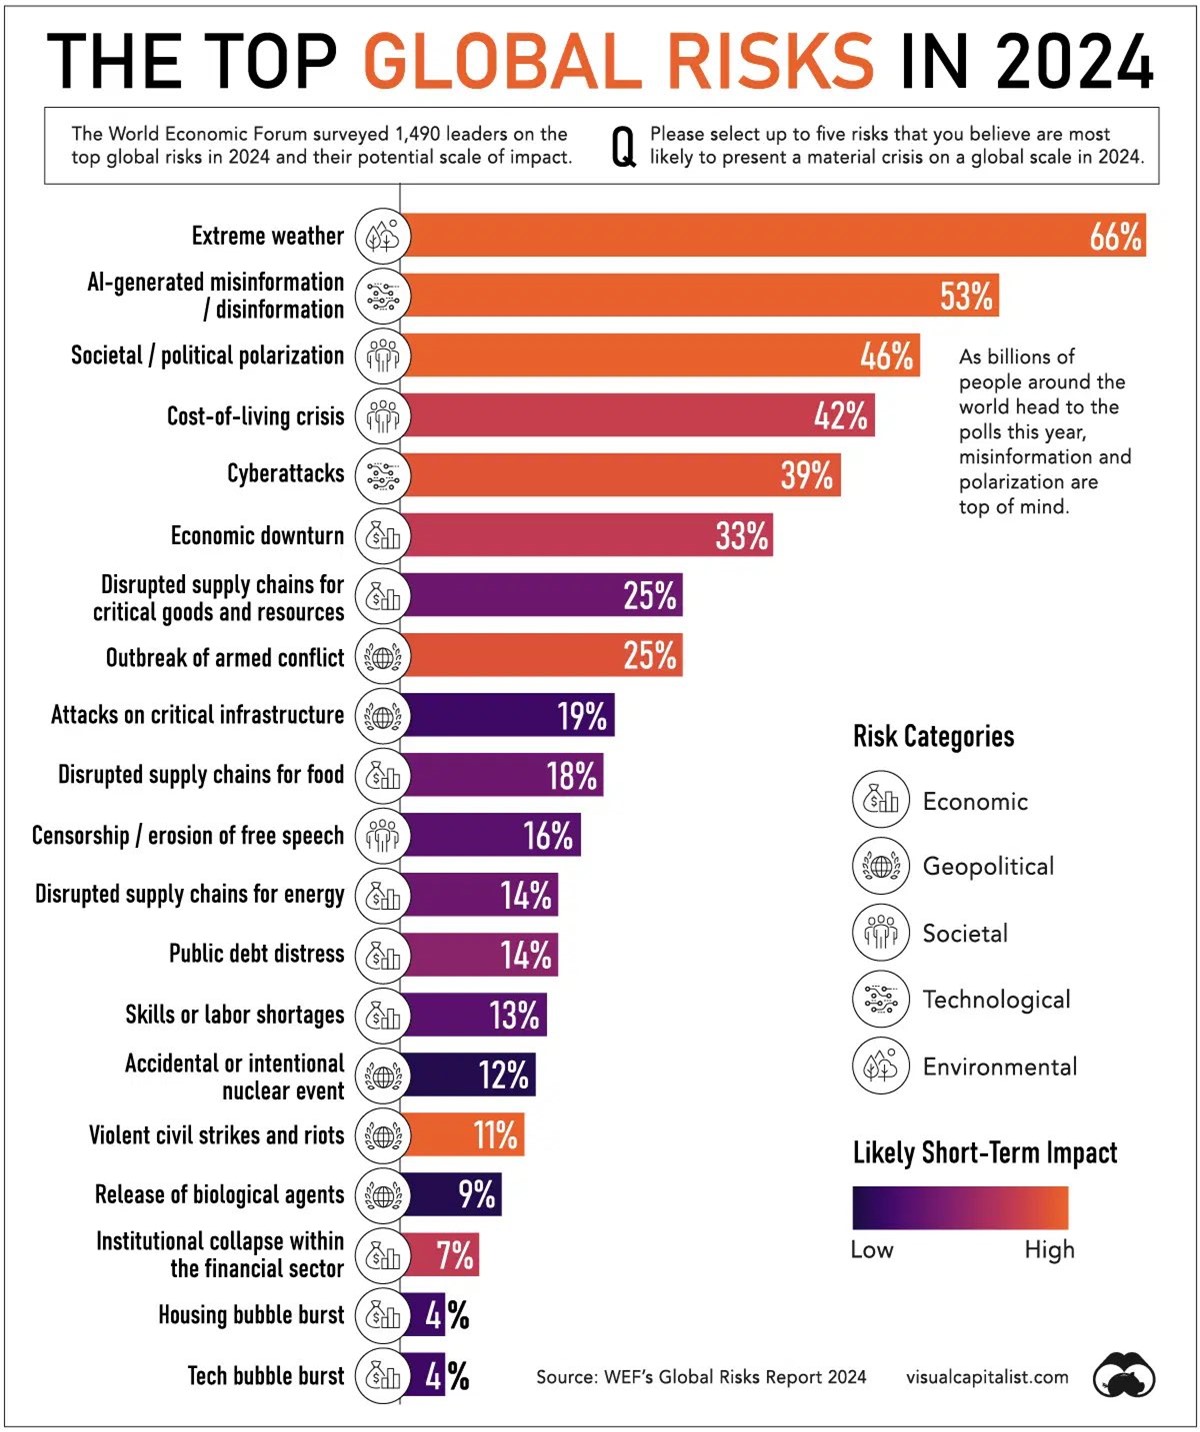
The World Economic Forum surveyed nearly 1,500 experts across the globe about what they view as the biggest global risks. Extreme weather, misinformation and disinformation and polarization topped the lists. Only one-third of respondents listed “economic downturn” among their top five threats.
I used Visual Capitalist’s chart because it is easier to read than the one published by the World Economic Forum.

-
AAII’s Quality Grade Undergoes Expansion: Looking Behind the Curtain
Based on research into various components that reflect a company’s “quality,” we tweaked the quality grade for stocks. -
Wealth and Retirement: Climate-Induced Financial Vulnerabilities
Extreme weather events have negative implications on income and retirement savings, particularly among younger individuals. -
I read this so you don’t have to! Nice Girls Don’t Get Rich by Lois Frankel
In her latest My Investing Discoveries blog post, Anine Sus reviews a 2005 financial advice book for women and relates the tips and lessons that are still applicable.
AAII Sentiment Survey
Optimism among individual investors about the short-term outlook for stocks fell in the latest AAII Sentiment Survey. Meanwhile, neutral sentiment increased to a level above its historical average.
Bullish sentiment, expectations that stock prices will rise over the next six months, decreased 8.2 percentage points to 40.4%. Bullish sentiment remains above its historical average of 37.5% for the 11th consecutive week.
Neutral sentiment, expectations that stock prices will stay essentially unchanged over the next six months, increased 5.6 percentage points to 32.9%. Neutral sentiment is above its historical average of 31.5% for the first time in seven weeks.
Bearish sentiment, expectations that stock prices will fall over the next six months, increased 2.6 percentage points to 26.8%. Bearish sentiment is below its historical average of 31.0% for the 11th consecutive week.
The bull-bear spread (bullish minus bearish sentiment) decreased 10.8 percentage points to 13.6%. The bull-bear spread is above its historical average of 6.5% for the 11th consecutive week.
This week’s special question asked AAII members which fixed-income instrument they are overweighting in their portfolios.
Here is how they responded:
- Money market funds: 36.8%
- U.S. Treasurys: 21.2%
- Investment-grade corporate bonds: 9.3%
- High-yield corporate bonds: 5.2%
- Other/not sure: 26.4%
Bullish: 40.4%, down 8.2 points
Neutral: 32.9%, up 5.6 points
Bearish: 26.8%, up 2.6 points
Bullish: 37.5%
Neutral: 31.5%
Bearish: 31.0%
See more Sentiment Survey results.

January 11, 2024 My Initial Observations on the New Spot Bitcoin ETFs
January 4, 2024 Where Market Indicators Stand as We Start 2024
December 28, 2023 AAII Members Expect Stocks to Rise and Bond Yields to Fall in 2024
December 21, 2023 December Charts of Interest: Stocks Are Overbought

Discussion
John L from Nj posted over 2 years ago:
Just because small caps are cheap based on historical valuations doesn't mean they won't get even cheaper in the near future. You won't know the bottom for small cap valuations until after it has occurred and it is too late to act. Good luck bottom fishers and market timers here is another opportunity to mess up and fall short of a simple buy and hold strategy. Based on their historical accuracy the "experts" are likely to be incorrect and the risk they don't forecast will be the one that really moves the needle. "Experts" are much more entertaining than prophetic. The main value of the nameless "experts" is to provide straw men for the media to write about.
M. Sharma from CA posted over 2 years ago:
WDFC - Piot score of 9 and good decent quality earnings.
Richard Halberg from PA posted over 2 years ago:
I am curious about how much of the disparity of performance noted in the charts is the result of the performance of the "magnificent seven." Their recent performance and domination of the S & P 500 is not sustainable in my opinion. It would be interesting to do the analysis without those high fliers and then look at the results. Also, how many people are chasing results and buying these outperformers, which only pushes them higher.
Barry from TX posted over 2 years ago:
The WEF survey results say so much about how the Davos illiterati see the world from their aeries as they fly over the poor people whose fates they calculate and calibrate as if they were breaking British party crackers. #1 This survey has 20 choices arrayed across the STEEP scale from Mike Porter’s HBS Business Policy I course. That’s de rigueur. #2 The “likely ST” heat scale coding tells us a lot about what they consider as most likely impacting 2024 (“red”) and what they see as so intractable (”blue”) that will require massive amounts of OPM to address in some distant future WEFs. #3 With these percentages, we can psychoanalyze the WEF collective consciousness that Klaus has carefully curated as the agenda for this WEF. #4 Deconstructing the STEEP factor percentages and rankings, I count 9 of the 20 (45%) of the risks are economic, 2 (10%) risks EACH are geopolitical, societal, or technological (#2-#5 and #8-#9 or 6 (60%) of the Top 10), and one environmental risk, “extreme weather” which is, of course, code for “climate change” is coded “hot red” as a very short-term risk. #5 If we correlate the heat map coded percentages with urgency, we see only risks #1 (climate risks) and #2 (AI risks) received a majority vote. That sounds familiar. Hum, oh yeah, the US Congress has the same chronic problem, meets approximately on the same schedule, has the same sense of urgency, and produces similar measurable outcomes. #6 From these survey data points (the list, the percentages, and the heat map codes), we can estimate that the Devosatti “group think” says (1) climate change is the biggest issue facing the world (surprise!) and (2) it is an immediate risk (double surprise!). #7 However, there is a huge disconnect in the authenticity of their focus because these are the same group of wealthy executives that are in the very positions charged with (a) doing something about climate change, and (b)to data, have punted their responsibilities so that (c) the most recent UN Climate Change report on how THEY are doing on meeting THEIR climate change commitments and goals says (d) THEY get an “F-“ on results to date which (e) THEY set 20 years ago in Paris with a deadline to make a dent in climate change metrics by LAST YEAR, and that (f) THEY continuously move out their commitments and goals while simultaneously (g) THEY blame everyone else – usually ONLY the Western developed nations -- for the failures they bemoan. #8 Remember, this is the same crowd that (a) has advanced to the most prestigious governmental, NGO, political, and corporate organizational positions in the world and (b) HAS the power, influence, and money (and dare I say the responsibility) to actually do something about the very risks they bemoan. #9 But they don’t. They have punted climate change results into some fluid future time zone and now they are focused on flying home for cocktail hour. Yawn. I sense such ennui. Let's do this again next year. Chin-Chin. Kiss-Kiss. Adios. Au revoir. Caio. Ma'a as-salama. Sayonara.
Barry from TX posted over 2 years ago:
What happened 11 weeks ago that produced the lock-step AAII Sentiment ratings for “11 weeks in a row” for the Bearish and Bullish ends of the scale? That was the week of Oct 30-Nov 3. It may have started earlier. I have noticed the statement “11 weeks in a row” has been traveling along with the AAII Surveys for a few months like a pig being slowly digested by a python. Are we locked into two “camps,” risk on (bears) and risk-off (bulls)? Bulls are @40% HA +3; Bears @27% HA – 4; and Neuts @33% HA +2. Those positions look like the FOMC votes Volker faced with 1980’s “stagflation.” Charles, is this “standoff ” worth a comment by you or just a reflection of the volatility of the markets and the inertia of buyers?
Barry from TX posted over 2 years ago:
Here is a possible answer. Friday 1/19/24 SPX closed @ 4,839 passing its previous record close @ 4796 on 1/3/022. SPX slumped as much as 25% from that peak, hitting its bottom for the cycle bear market on 10/12/22. A sharp rally after 10/22/23 was interpreted as inflation was cooling, and dovish Fed messages helped drive stocks higher. SPX ended 2023 up 24%. SPX had a bumpy start to 2024 to get to the 1/19/24 new high. The interplay between stocks and Treasury yields has been a key driver of market moves over the last two years. DJIA also hit a record closing high Friday 1/19/24 which had already been confirmed on 12/13/23. DJIA had been in a bull market since 9/30/22. NDX recovered 43% in 2023 but remains down 4.8% from its record high @16,057 on 11/19/21. If you remember how the dot.com/internet boom played out in 2000, you may want to watch GAI/Chatbot trends carefully in 2024. There may be another type of November surprise in 4Q24.
You need to log in as a registered AAII user before commenting.
Create an account