

Dividend Stocks Yielding 10% or More
by Charles Rotblut | March 07, 2024
Featured Tickers: EQNR
EQNR
PRT
SSIC
UAN
While gathering information for this week’s commentary, I noticed that there are currently 91 exchange-listed stocks trading with yields of 10% or higher. Out of sheer curiosity, I decided to take a closer look.
Yields range from 10.0%—Great Ajax Corp. (AJX), PermRock Royalty Trust (PRT) and Silver Spike Investment Corp. (SSIC)—to 28.5% for CVR Partners LP  (UAN). As of Tuesday’s close, there were a total of four stocks with yields greater than 20%. The median yield of the passing companies was 12.5%.
 Two out of five double-digit-yielding stocks are classified as real estate investment trusts (REITS). LSEG Data & Analytics lists most of these trusts in the specialized REITs industry group. There were also 17 energy-related businesses. Many of these were either master limited partnerships (MLPs) or publicly traded trusts.
A variety of industries and sectors were represented by the other stocks, including banks, business development companies (BDCs), retailers and utilities. (I excluded the relatively small number of closed-end funds with yields of 10% or higher that appeared in the screen’s results. I also excluded companies lacking 12-month dividend data.)
Given this diversity, not all typical financial measures are applicable. There are some metrics used to calculate the dividend grades for AAII Dividend Investing that we can use to do a cursory analysis on these very high-yielding stocks.
One is dividend growth. This metric simply measures whether the dividend paid over the past 12 months is higher or lower than the dividend paid over the previous 12 months. The median value is 0.0%. Thirty-two of these companies have raised their dividends while 36 have lowered their dividends within the past 12 months. Dividend growth is good, while dividend cuts are very bad. Some of these companies may have variable dividend (distribution) payments due to the nature of their businesses. (There were eight companies with growth data missing.)
Another measure is the dividend payout ratio. It measures the percentage of earnings paid out as dividends. Twenty-eight of these companies have payout ratios above 100%, which are not sustainable. There was a high level of null values for this group as well, which means the company is losing money.
Cash from operations shows whether a company’s normal business operations are bringing in more cash (positive values) than they use (negative values). Eighteen of the 91 high-yield stocks on this list (19.7%) have negative cash flow. Negative cash flow is a cautionary signal.
Debt is an important consideration. Too much debt can hurt a company’s ability to pay dividends and, obviously, put it at risk of financial duress. In addition, debt covenants can force a company to cease dividend payments. The median long-term debt-to-equity ratio was 100.5%. This ratio implies these stocks are highly leveraged.
Finally, most of the companies on this list are small. The median market capitalization is just $672.9 million. Norwegian oil and gas company Equinor ASA (EQNR) is the largest with a market cap of $75.1 billion.
Not reflected in any of these numbers are tax issues. Distributions from REITs are taxed at ordinary income rates. MLPs have their own tax complexities, starting with the issuance of Form K-1. Some of these high yields may include return of capital. When a company returns capital, it lowers your tax basis in the stock.
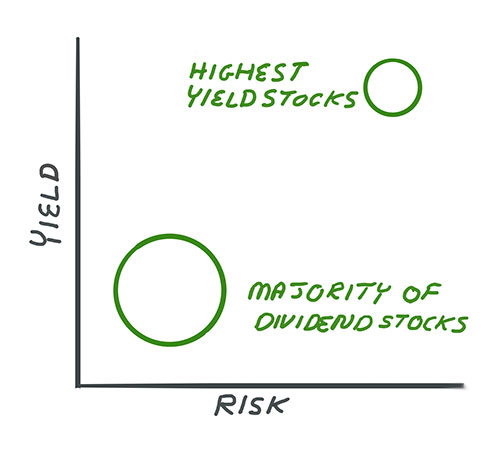
While high yields can seem alluring, it’s always important to realize that they reflect a heightened level of perceived risk. Investors are demanding such high yields to justify the perceived elevated odds of incurring a loss on their investment. A large drop in a stock’s price will more than offset a high dividend. Therefore, while these double-digit yields have the appearance of being juicy, there is a real risk these stocks could leave you with an upset stomach.
Click here to download the full list of exchange-listed stocks yielding 10% or more.

-
Pros and Cons of Two Dividend Investing Strategies
Which are the better dividend-paying stocks—stocks with a lower initial yield but with a high dividend growth rate, or stocks with a low dividend growth rate but with a higher initial yield? -
Viewing the Sector Exposure of Dividend Stocks Through the Aristocrats
One factor that dividend investors often overlook is asset allocation, or the type of firms being invested in. -
Beyond the Numbers: Getting Started With Financial Statements
Setting the stage for our new AAII Journal series by introducing basic concepts for mastering company analysis.
AAII Sentiment Survey
Optimism among individual investors about the short-term outlook for stocks increased in the latest AAII Sentiment Survey. Meanwhile, pessimism slightly increased and neutral sentiment decreased.
Bullish sentiment, expectations that stock prices will rise over the next six months, increased 5.2 percentage points to 51.7%. Bullish sentiment is unusually high and is above its historical average of 37.5% for the 18th consecutive week.
Neutral sentiment, expectations that stock prices will stay essentially unchanged over the next six months, decreased 5.7 percentage points to 26.5%. Neutral sentiment is below its historical average of 31.5% for the fifth time in six weeks.
Bearish sentiment, expectations that stock prices will fall over the next six months, increased 0.4 percentage points to 21.8%. Bearish sentiment is below its historical average of 31.0% for the 18th consecutive week.
The bull-bear spread (bullish minus bearish sentiment) increased 4.8 percentage points to 30.0%. The bull-bear spread is above its historical average of 6.5% for the 18th consecutive week.
This week’s special question asked AAII members how, if at all, they have changed their approach to investing recently.
Here is how they responded:
- Switched around some investments, but modest changes overall: 30.8%
- Become slightly more conservative: 20.8%
- Become more aggressive: 14.5%
- Become much more conservative/cautious: 9.3%
- No changes: 23.5%
Bullish: 51.7%, up 5.2 points
Neutral: 26.5%, down 5.7 points
Bearish: 21.8%, up 0.4 points
Bullish: 37.5%
Neutral: 31.5%
Bearish: 31.0%
See more Sentiment Survey results.

AAII Asset Allocation Survey
Individual investors’ allocations to equities slightly increased in the February Asset Allocation Survey.
Stock and stock fund allocations increased 0.8 percentage points to 67.8%. Stock and stock fund allocations are above their historical average of 61.5% for the 45th consecutive month.
Bond and bond fund allocations decreased by 0.7 percentage points to 15.4%. Bond and bond fund allocations are below their historical average of 16.0% for the first time in four months.
Cash allocations decreased 0.1 percentage points to 16.8%. Cash allocations are below their historical average of 22.5% for the 15th consecutive month.
- Stocks and Stock Funds: 67.8%, up 0.8 percentage points
- Bonds and Bond Funds: 15.4%, down 0.7 percentage points
- Cash: 16.8%, down 0.1 percentage points
- Stocks: 30.6%, up 0.0 percentage points
- Stocks Funds: 37.3%, up 0.8 percentage points
- Bonds: 5.0%, down 0.5 percentage points
- Bond Funds: 10.3%, down 0.2 percentage points
- Stocks/Stock Funds: 62.0%
- Bonds/Bond Funds: 16.0%
- Cash: 22.0%
Take the Asset Allocation Survey.
February 29, 2024 Warren Buffett on Why You Shouldn't Trust Forecasts
February 22, 2024 February Charts of Interest: The Impacts of Inflation and Interest Rates
February 15, 2024 The 25x4 Allocation Is Questionable
February 8, 2024 Very High-Cost Mutual Funds and ETFs (Along With Cheaper Alternatives)

Discussion
Barry from TX posted over 2 years ago:
Charles, although you were very careful to list many reasons why these 91 very high dividend stocks have inherently serious risks, the timing is inauspicious. AAII sentiment and allocation survey data indicate that March sentiment and allocation movements are very low. Are IIers deer in the headlights? They know something is bearing down on them, but are frozen in their positions, which for some are unfortunately either in the middle of the road or in the wrong lane. The AAII sentiment and allocation data mirror a WSJ article today on the increased demand for “autocallables.” See “Markets Are Lulling Themselves Into a False Sense of Security, @ this “Gift Link” https://www.wsj.com/finance/investing/markets-are-lulling-themselves-into-a-false-sense-of-security-4e7f48eb?st=q5qd02creh6jmnc&reflink=desktopwebshare_permalink. This is another example that the search for higher returns at higher risk are rampant. People sense there is so much risk with so many economic factors that they are demanding higher returns. That was the subtext of our article and the WSJ piece and the warning in your article. Freezing in place seems to be an awkward strategy to handle risk. Long-term investors may get yet another opportunity to test the depths of their beliefs in the validity of their mantra that “there is no risk” in a “buy and hold” strategy and how long it takes markets to recover to the current Himalayan peaks. Now may be a very propitious time to deploy a “3D” strategy -- Deleverage, Derisk, and/or Depart.
John L from NJ posted over 2 years ago:
Maybe Barry. Remember December 1996 when the future Nobel Prize winner (Shiller) and head of the Fed (Greenspan) knew that the stock market was too high. "Irrational Exuberance" Time to get out! Of course this was three years too early. So much for credentials and genius. Anyone who followed this advice missed three years of 20% plus gains. To time the market you need to make two accurate calls - 1) When to get out and 2) when to get back in. Paraphrasing John Bogle "I don't know anybody who has successfully timed the stock market or anybody who knows anybody who has successfully timed the stock market".
You need to log in as a registered AAII user before commenting.
Create an account