

Very High-Cost Mutual Funds and ETFs (Along With Cheaper Alternatives)
by Charles Rotblut | February 08, 2024
Featured Tickers: AMRBXAMRCX
 BDCZ
BGEIX
BIZD
BDCZ
BGEIX
BIZD
EGLNX
MAXI
MIDSX
MLPRX
PRPAX
RYJUX
Experience the pinnacle of investing education at the MoneyShow Conference in Las Vegas from February 21 to 23, 2024. Gain invaluable insights from AAII’s exclusive sessions: Raymond Rondeau’s “Wealth-Building Strategies” and Wayne Thorp’s “Screening Like a Stock Superstar.” These sessions will expand your investing strategy and refine your stock selection process with practical tips and advanced techniques. Follow this link to learn more and register today!
It is always prudent to paraphrase Patti Page and ask, “How much is that fund in the window?” Not doing so can put your portfolio on a sure path to underperforming the very same asset classes you are targeting. (For those of you who don’t get the song reference, Page famously asked, “How much is that doggie in the window?”)
A handful of mutual funds and exchange-traded funds (ETFs) I found while doing some work with the beta versions of our redesigned mutual fund and ETF screeners show why. Their fees are higher than you would expect.
How high? The American Growth One B fund (AMRBX) has a stated expense ratio of 7.10%. In addition, it has a back-end load (deferred charge) of 5.00%. Yikes! The C share class of the fund (AMRCX) is comparatively less pricey, though still darn expensive, with an expense ratio of 6.43%, a back-end load of 1.00% and a 12b-1 fee of 1.00%. (12b-1 fees cover marketing expenses and do nothing to benefit a fund’s shareholders.)
American Growth One invests primarily in large-cap growth stocks—a part of the market with many low-cost mutual funds and ETFs to choose from.
The second-most-expensive mutual fund is Invesco SteelPath MLP Income C  (MLPRX). It has an expense ratio of 5.64%, a back-end load of 1.00% and 12b-1 fee of 1.00%. As it name implies, Invesco SteelPath MLP Income focuses on master limited partnerships. In contrast, the Eagle MLP Strategy N fund (EGLNX) has an expense ratio of 1.26% and is among four other MLP-related no-load mutual funds widely available to individual investors.
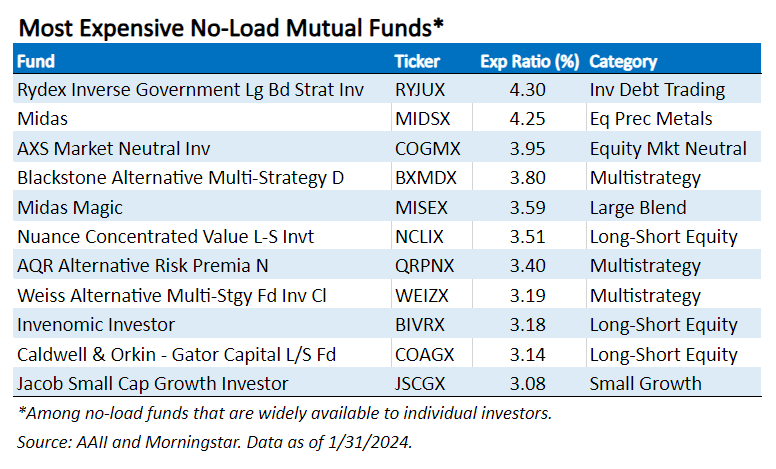
Narrowing down the broader list to no-load mutual funds that are available to most individual investors still identifies 11 with expense ratios above 3.00%. The Rydex Inverse Government Long Bond Strategy fund (RYJUX) and the Midas fund (MIDSX) carry expense ratios of 4.30% and 4.25%, respectively. Put another way, both mutual funds must realize returns north of 4% each year just to ensure their shareholders don’t see the value of their investments drop.
Rydex Inverse is designed to deliver a return opposite of the long-term Treasury bond (currently the 30-year Treasury bond). You have to both hold the fund at the right time and hope its returns are high enough to offset the expense ratio.
Midas invests in precious metal companies and precious metals. There are seven other comparable no-load mutual funds. The American Century Global Gold fund (BGEIX) is among them. Its expense ratio is a much lower 0.66%.
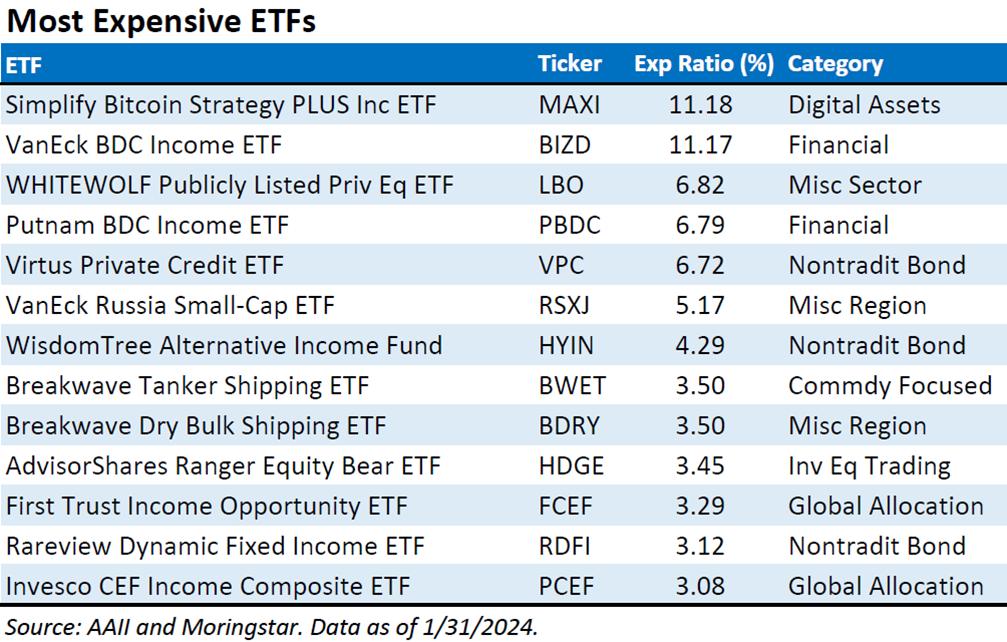
Among ETFs, 13 funds have expense ratios above 3.00%. The Simplify Bitcoin Strategy PLUS Income ETF (MAXI) and the VanEck BDC Income ETF (BIZD) lead the group by charging 11.18% and 11.17%, respectively. VanEck also comes with a hefty tax-cost ratio of 4.0%.
Simplify Bitcoin mixes bitcoin futures with option spreads. I’m not sure why someone would want a single fund that mixes a bitcoin strategy with an options-based income strategy. As of last month, there are now ETFs that provide direct exposure to bitcoin instead of using futures contracts. All of them are now included in the online version of our ETF guide under the digital assets category of the alternative fund group. There are also 247 ETFs included in the options trading category of the alternative fund group if you are more interested in that part of the Simplify Bitcoin ETF.
The VanEck invests in business development companies. There isn’t much choice in terms of alternatives within in the ETF arena. The UBS ETRACS Wells Fargo Business Development Co. ETN (BDCZ) has an expense ratio of 0.85%. Its structure as an exchange-traded note (ETN) creates some credit risk because it is a debt instrument as opposed to an actual fund.

-
Top Considerations When Comparing Funds
How to conduct a head-to-head comparison of two mutual funds, taking into consideration the relationship between risk and return and the impact of costs and taxes on your realized returns. -
Different 12b-1 Fees Among a Fund’s Share Classes Create a Conflict of Interest
When a fund has a range of share classes with different 12b-1 fees, an incentive exists for distributors to steer investors to the class with the higher fee. -
Speculative Assets Placed Into ETFs Can Still Be Wrecking Balls
The latest example of a risky asset being placed into a fund wrapper is bitcoin.
AAII Sentiment Survey
Neutral sentiment among individual investors about the short-term outlook for stocks increased in the latest AAII Sentiment Survey. Meanwhile, pessimism decreased while optimism was unchanged.
Bullish sentiment, expectations that stock prices will rise over the next six months, was unchanged at 49.0%. Bullish sentiment is at an unusually high level and is above its historical average of 37.5% for the 14th consecutive week.
Neutral sentiment, expectations that stock prices will stay essentially unchanged over the next six months, increased 2.0 percentage points to 28.4%. Despite the increase, neutral sentiment is below its historical average of 31.5% for the eighth time in 10 weeks.
Bearish sentiment, expectations that stock prices will fall over the next six months, decreased 2.0 percentage points to 22.6%. Bearish sentiment is below its historical average of 31.0% for the 14th consecutive week.
The bull-bear spread (bullish minus bearish sentiment) increased 1.9 percentage points to 26.5%. The bull-bear spread is at an unusually high level and is above its historical average of 6.5% for the 14th consecutive week.
This week’s special question asked AAII members what they thought about the Federal Reserve’s decision to keep interest rates unchanged.
Here is how they responded:
- It was the right decision: 79.3%
- They should have cut rates: 8.8%
- They should have raised rates: 5.5%
- Not sure/no opinion: 5.8%
Bullish: 49.0%, down 0.0 points
Neutral: 28.4%, up 2.0 points
Bearish: 22.6%, down 2.0 points
Bullish: 37.5%
Neutral: 31.5%
Bearish: 31.0%
See more Sentiment Survey results.

AAII Asset Allocation Survey
Individual investors’ allocation to equities slightly increased in the January Asset Allocation Survey.
Stock and stock fund allocations increased 0.6 percentage points to 67.0%. Stock and stock fund allocations are above their historical average of 61.5% for the 44th consecutive month.
Bond and bond fund allocations decreased 0.2 percentage points to 16.1%. Bond and bond fund allocations are above their historical average of 16.0% for the third time in 35 months.
Cash allocations decreased 0.4 percentage points to 16.9%. Cash allocations are below their historical average of 22.5% for the 14th consecutive month.
Optimism in the weekly AAII Sentiment Survey was above its historical average and pessimism was below its historical average at the end of January.
- Stocks and Stock Funds: 67.0%, up 0.6 percentage points
- Bonds and Bond Funds: 16.1%, down 0.2 percentage points
- Cash: 16.9%, down 0.4 percentage points
- Stocks: 30.5%, down 0.1 percentage points
- Stocks Funds: 36.4%, up 0.7 percentage points
- Bonds: 5.5%, up 0.2 percentage points
- Bond Funds: 10.6%, down 0.4 percentage points
- Stocks/Stock Funds: 62.0%
- Bonds/Bond Funds: 16.0%
- Cash: 22.0%
Take the Asset Allocation Survey.
February 1, 2024 Putting Money Into the Market, the Fed and the January Barometer
January 25, 2024 Optimism Among Individual Investors Bounced Back Last Year
January 18, 2024 January Charts of Interest: Quality Boosts Returns
January 11, 2024 My Initial Observations on the New Spot Bitcoin ETFs

Discussion
Barry from TX posted over 2 years ago:
Charles, this article may appear to many as just a regurgitation of something all AAIIers already know: mutual funds are much more expensive than ETFs. What may not be widely known is that this article is very timely and very important for mutual fund and ETF investors. Your good friend Jason Zweig – the other “Intelligent Investor-- must be channeling/communicating with you. In his WSJ column today (2/9/24), Jason explains how Vanguard patented the idea of ETFs as a share class alongside a mutual fund in 2005 and that patent expired in 2023. Since then, many large mutual funds providers (“the usual suspects”) filed requests with the SEC and have been approved to create ETF share classes for their existing MFs and several others are preparing similar requests. ETF share classes allow mutual fund providers to add an ETF share class onto an existing mutual funds as an identical portfolio. Here is the non-subscriber “gift link” to today’s Zweig article https://www.wsj.com/finance/investing/your-MF-stinks-can-this-wall-street-invention-change-that-73e86075?st=y2j760m1a9zvpx0&reflink=desktopwebshare_permalink and an earlier article on this topic https://www.wsj.com/articles/SB10001424127887324624404578255940811549604. PS. Just for sentimentalists, Ella Fitgerald’s signature song “How High the Moon?” would have been a good follow-up to your second question, “How high?, to develop your 1950’s leitmotif. I am guessing your choice of Doris Day was driven by an analogy to these funds as being dogs. Any additional information you can provide on ETF share classes inside mutual funds would be appreciated.
Gareth from MN posted over 2 years ago:
I am not familiar with all of the funds mentioned. Though I do not currently own it, I have been interested in BIZD in the past. BIZD is a fund of funds, and my understanding is that by regulation they are required to count in their fees and expenses the fees and expenses of the acquired funds BIZD holds. Thus, the 11.17% expense ratio in the article is terribly misleading because it is not a direct charge (or reduction of yield) to the shareholder. The yield after taking into account the expenses was 10.81% as of close Feb. 8. Why should one care what the expense ratio is if one can receive a 10%+ yield after expenses? BIZD's actual management fee is 0.4% (4/10th of a percent) which is more pertinent, while the acquired funds fees and expenses make up the difference. Because the author doesn't address this for BIZD (that the relevant fee appears to be 0.4%) and other so-called high-fee funds that are similar, and that the reported expense ratio doesn't reduce the effective yield, I have to question the credibility of the article and the conclusion that BIZD and others are expensive. If I were to invest in BIZD, would my total return differ materially than if I were to invest in the portfolio of funds embedded in BIZD? Their top 3 holdings comprising about 45% of their portfolio are ARCC, FSK and OBDC. As an individual investor, I don't believe I could do better that those who do it for a living. At the same time, while I might be comfortable with some of their picks, I might not be as enthralled with some of the not-so-good ones. Is the 0.4% management worth my not having to manage the multiple funds? I think that is a small price to pay for someone else managing the complexities of investing in multiple funds. They are also much more effective than I could ever be in using leverage to enhance long-term results.
Gareth from Minnesota posted over 2 years ago:
To say a little more, the point the author appears to be making is absolutely correct; that management fees, even small percentages, can eat up a significant amount of investment returns, especially over time with the compounding effect. If one's financial advisor charges "only" 1% of one's assets under management (the way the advisor would typically characterize it), I would suggest looking at it differently. If one were to expect an average annual return of 8%, the advisor's fee is actually 12.5% (1% divided by 8%) of the expected return. The principle espoused in the article is sound. However, it appears to be misapplied, at the very least in part, in the examples given.
You need to log in as a registered AAII user before commenting.
Create an account