

The Upsides of High Inflation
by Charles Rotblut | September 29, 2022
Nobody likes high inflation. My wife has been cringing at what it costs to eat out these days. A local place we like is charging $17 for a salad. It is both a good and generously portioned salad, but $17 is still surprising for a casual, suburban eatery.
While I’m certain that you too have noticed prices on many other items become much higher than they used to be, there are some upsides to the high inflation.
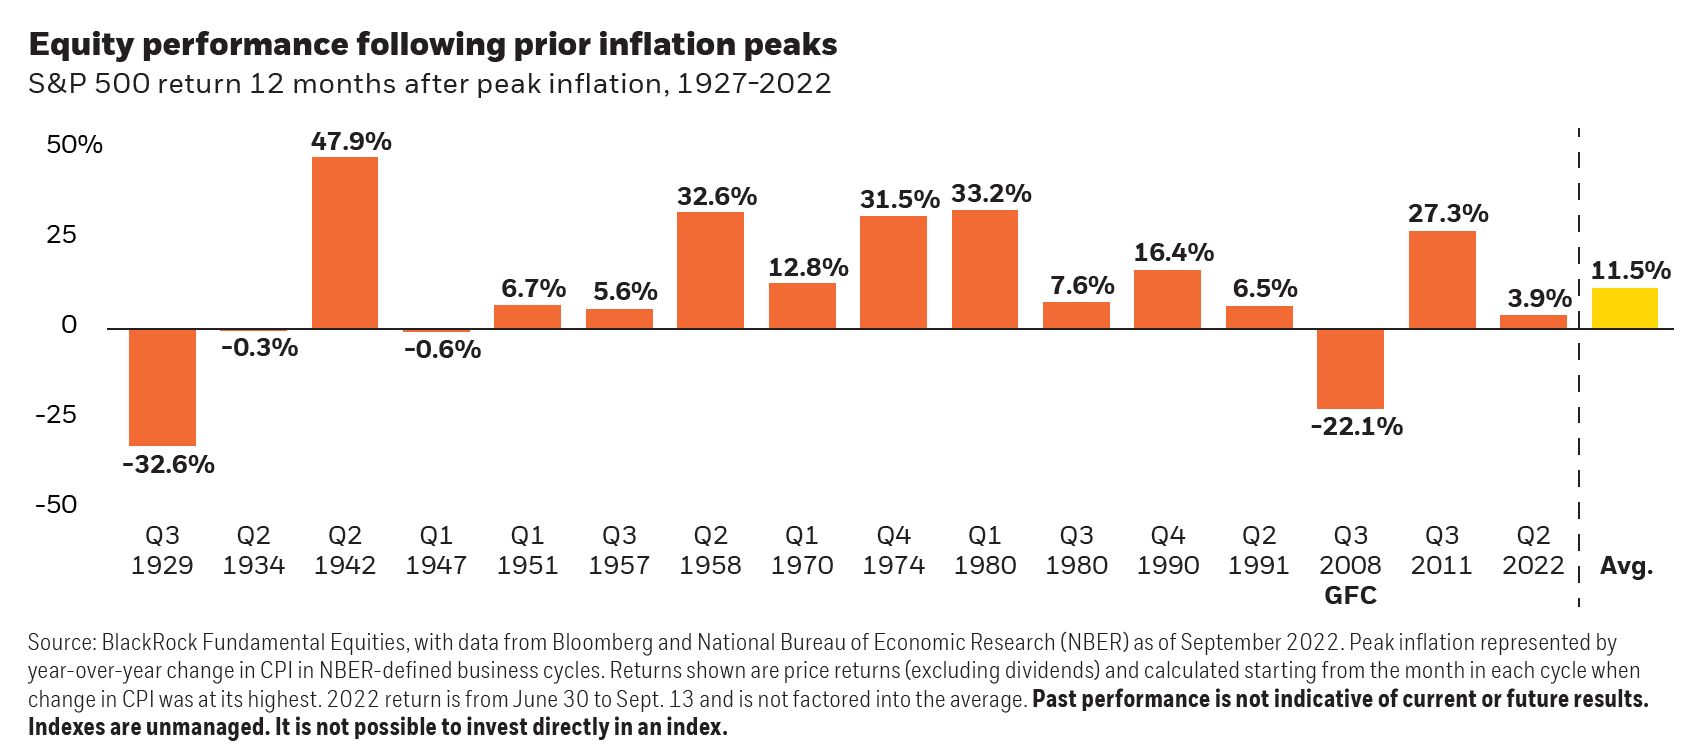
I’ll start with stocks, given that we’re experiencing another bout of downside volatility. Stocks have historically performed well once inflation has peaked. “Since 1927, the average S&P 500 return in the 12 months following an inflation crest was 11.5%,” wrote Tony DeSpirito, a chief investment officer with BlackRock, in a report this week.
He went on to say that “value stocks have a history of outperforming growth amid high (4.5% and above) and even moderate (1.1%–4.4%) inflation.” There may also be an opportunity in terms of combining growth and value. Russell 1000 index companies with a 50/50 mix of growth and value outperformed the market following four of the six inflation peaks since 1978, according to DeSpirito.
Bond Yields Are Higher
Bond yields are higher as the Federal Reserve has raised interest rates to combat inflation. This has created an opportunity for income-seeking investors to lock in bigger coupons than they have been able to get in quite some time. And, yes, those coupons could get even bigger as the Fed continues to raise interest rates.
What’s surprisingly not being talked about is U.S. Treasury Series I bonds. I bonds issued through next month (October) yield 9.62%. The fixed rate on these bonds is 0.0% and the semiannual inflation rate is 4.81%. When the next rate reset goes into effect in November, the inflation segment will be adjusted on the non-seasonally adjusted consumer price index (CPI) for all urban consumers (CPI-U) for all items. Those who currently own I bonds, like me, will get the inflation adjustment—which I expect to still be juicy.
New I bonds issued starting in November may also have a fixed rate above 0.0% given the Fed’s rate hikes. How much above 0.0% remains to be seen, but the increase will add to the yield paid by new I bonds.
Keep in mind that there is a $10,000 per person per calendar year limit on buying electronic I bonds. The inflation component can be reduced, and future yields may be lower than they are now. You can sell I bonds after one year, but you will forfeit the last three months of interest if you sell your I bonds within five years of purchase.
Treasury inflation-protected securities (TIPS) are also paying more in income. The principal on these bonds adjust to inflation. Higher rates of inflation mean bigger increases to these bonds’ principal amounts, and the adjustments are cumulative. (We’ll have a new article about TIPS in the November AAII Journal.)
Yields Are Higher on Savings Accounts Too
Yields on savings accounts, money market accounts and certificates of deposits (CDs) have risen. AAII members can earn 2.15% on their savings through our affinity program with Discover, for instance. These higher rates, while welcome, are still lower than what one should expect from a long-term allocation to stocks. Safe assets like these are meant for short-term and emergency savings, not for money intended for long-term goals.
Tax Adjustments Could Be Welcome News
Finally, the next year’s tax adjustments may come as welcome news. Bloomberg Tax is projecting an approximate 7.1% increase in inflation-adjusted tax limits, exemptions and deductions. An example is the standard deduction, which could rise from $25,900 to $27,700 for married joint filers. The maximum limit for qualifying for the 0% capital gains rate could rise to $89,250 for married joint filers as well.
These are projections; the Internal Revenue Service (IRS) should announce the actual adjustments in November. Our tax guide, included in the December AAII Journal, will list the key 2023 tax numbers you will need to know.

-
Why I Bonds Have Appeal When Inflation Is Rising
With part of its interest rate based on the rate of inflation, Series I savings bonds might be worth a look in the current environment. -
Online Exclusive: Defining Inflation for Your Portfolio
Any time in history when a nation has seen a dramatic increase in available cash, inflation has been a concern. How should investors respond when inflation heats up and poses risk to their portfolios? -
Segmenting Growth Stocks With the G-Score
An eight-point scale based on fundamental factors helps to identify attractive growth stocks and avoid weak growth companies. -
Online Exclusive: Market Breadth’s Meaning for Individual Investors
Market breadth is often used by fundamental investors to help determine the most opportune time to execute a trade once a decision to buy or sell has already been made. -
Setting High-Yield Savings Goals
Anine Sus revisits her high-yield savings accounts and their increasing interest rates in her latest My Investing Discoveries blog post.
AAII Sentiment Survey
The results from the latest AAII Sentiment Survey show pessimism about the short-term direction of the stock market continuing to stay near record high levels. Plus, this week’s bullish sentiment reading ranks among the 50 lowest in the survey’s history.
Bullish sentiment, expectations that stock prices will rise over the next six months, increased by 2.2 percentage points to 20.0%. Optimism is below its historical average of 38.0% for the 45th consecutive week. It is also unusually low for the fifth consecutive week and the 28th time in 39 weeks. The breakpoint between typical and unusually low readings is currently 27.6%.
Neutral sentiment, expectations that stock prices will stay essentially unchanged over the next six months, declined 2.2 percentage points to 19.2%. Neutral sentiment is below its historical average of 31.5% for the 21st time in 23 weeks. It is also at an unusually low level. The breakpoint between typical and unusually low readings is 23.1%.
Bearish sentiment, expectations that stock prices will fall over the next six months, declined 0.1 percentage points to 60.8%. This is the first time in the survey’s history pessimism is above 60% on consecutive weeks (it was 60.9% last week). Bearish sentiment is above its historical average of 30.5% for the 44th time out of the past 45 weeks and is at an unusually high level for the 29th time out of the last 37 weeks. The breakpoint between typical and unusually high readings is currently 40.6%.
The bull-bear spread (bullish minus bearish sentiment) is –40.9% and is unusually low for the 30th time in 36 weeks. This week’s reading ranks among the most negative in the survey’s history. The breakpoint between typical and unusually low readings is currently –11.0%.
Bearish sentiment has only been above 60% four other times prior to last week and this week. Those dates were August 31, 1990 (61.0%), October 19, 1990 (67.0%), October 9, 2008 (60.8%), and March 5, 2009 (70.3%).
Historically, the S&P 500 index has gone on to realize above-average and above-median returns during the six- and 12-month periods following unusually low readings for bullish sentiment and the bull-bear spread. Unusually high bearish sentiment readings historically have also been followed by above-average and above-median six-month returns in the S&P 500. The S&P 500 has underperformed following periods of below-average neutral sentiment, though the link is weaker.
Continued volatility in the major stock indexes along with inflation, corporate earnings and increased chatter about the possibility of a recession are all likely weighing on individual investors’ short-term expectations for the stock market. Also influencing sentiment are monetary policy, politics and the ongoing invasion of Ukraine by Russia.
Bullish: 20.0%, up 2.2 points
Neutral: 19.2%, down 2.2 points
Bearish: 60.8%, down 0.1 points
Bullish: 38.0%
Neutral: 31.5%
Bearish: 30.5%
See more Sentiment Survey results.

September 22, 2022 Another Rate Hike as Concerns About a Recession Increase
September 15, 2022 Profit Margins Have Gained in Importance
September 8, 2022 401(k) Tips and Useful Information
September 1, 2022 New Innovations: Single Stock and BuyWrite Bond ETFs

Discussion
Ken from OHIO posted over 4 years ago:
There is a $10,000 cap on purchasing I bonds in a given year, not a $10,000 limit on owning them.
Carl from NJ posted over 4 years ago:
Have been buying I Bonds for years and it's the one part of my portfolio that helps maintain my sanity in bear markets.
Barry J from TX posted over 4 years ago:
I offer a few cautions when screening for value stocks. I learned these the hard way when I launched a Value strategy last year to help me fight expected volatility. Many ETFs do not distinguish between the terms “value” and “quality” in their fund descriptions. They think “Quality” includes “Value.” Research (notably Fama and French, see Cloonan’s “Investing at Level3”) has identified “value” stocks mainly as the “size” factor, meaning that small-cap stocks provide ROIs higher than the underlying markets indexes. Thus, many investors think of “small caps” (another proven anomalous factor) as being “value stocks”. They are. But, when you run a “value” screen you may find the solution set dominated by LARGE “VALUE” stocks. That’s how the fund sees them. I recommend you go to the FactSet datasheets and review the Morningstar 9-Box Style graphic that lists the percent of AUM in the ETF along two dimensions – [Large ? Medium ?Small] and [Value ? Blend ? Growth], thus producing the “9 boxes.” This data will help you determine the TRUE “weighting” percentages each ETF candidate has for THE “value” factors you are trying to capture. I also recommend you review the Top 10 holdings list to ensure the ETF management has not weighted – or “titled” - the ETF toward LARGE cap stocks – Inspector Renault’s “usual suspects” – that also “boost” the ETF’s VOLATILITY, one of the factors you are trying to minimize. They do fit under their “Quality” rubric, but they are definitely not “Value” or “Small cap.” Many data sheets also provide a list of the percentage of assets in the ETF for of the 11 SPX sectors. This data can help identify the degree of “tilt” in your investment percentages – you want to capture or avoid -- – the sectors that have histories of being more volatile than others. One more caution. Someday – hopefully sooner than later – the business cycle “hurricane” luring in the background – a reality in every economy – will complete the “fat tail” stage of the current cycle (the painful low-growth, low -returns period we are in now) and begin a new one. When that happens, all the “factors” and “tilts” will reset from “value” to “growth.” The Fed Dot Plot “forecasts” the “fat tail” of current business cycle may persist through 2024. (Yep, it’s that bad. Go look at Fed.com.) This statement is based on the “hope” that the current Fed rate increase strategy gets things right the first time. Don’t count on it. They have less than a Hall of Fame batting average, which is 3 of the last 11. Like Mike Tyson said, “Everyone thinks they can beat me … until I hit them.” Powell may want to expand his readings on strategy development to include sources on strategy implementation outside economic journals.
Charles Rotblut from Illinois posted over 4 years ago:
Hi Ken,
Yes, it should have said a purchasing limit of $10,000 per year for electronic I bonds. A correction has been made. Technically, the limit is also per trust and partnership, so a person could get around the limit if they had other entities by which to purchase I bonds and were willing to set up separate Treasury Direct accounts.
-Charles
You need to log in as a registered AAII user before commenting.
Create an account