

Another Rate Hike as Concerns About a Recession Increase
by Charles Rotblut | September 22, 2022
Yesterday, the Federal Open Market Committee (FOMC) raised interest rates by 75 basis points (bps). This was third consecutive time the FOMC has raised rates by this magnitude. Cumulatively, this year’s five rate hikes total 300 bps (3.0%).
The last time the target for the federal funds rate was at this level was January 2008.
Bond yields are also at multiyear highs. Yesterday’s closing yield of 3.51% on the benchmark 10-year Treasury note was the highest since 2011. 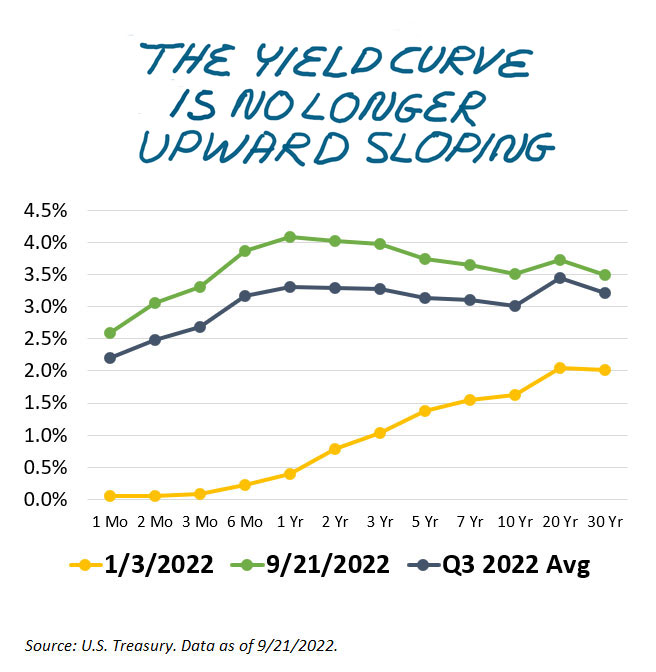
In the backdrop of this is a general downtrend in inflation expectations. The 10-year breakeven inflation rate was 2.38% yesterday, down from a multiyear peak of about 3.00% in April. The five-year breakeven rate was 2.47% yesterday versus nearly 3.60% in March.
Worries about inflation are starting to be overshadowed by worries about a recession. Corporations, for instance, are mentioning the “R-word” with much greater frequency, as Matt Markowski noted in his Stock Superstars Report commentary last week.
“Of the [S&P 500 index] companies reporting second-quarter results, 240 of them mentioned the word ‘recession’ during their earnings calls,” wrote Matt citing data from FactSet. “This is the highest number of companies to do so since 2010. It also is much higher than the five-year average of 52 companies. The previous record of 212 companies occurred after the first quarter of 2020 when the coronavirus pandemic arose.”
A more widely used recession forecasting tool is the Treasury yield curve. Inverted yields have historically been a harbinger of recessions. With about a week to go into the quarter, interpretations depend on how one looks at the yield curve.
Duke professor Campbell Harvey, who first found the link between inverted yield curves and recessions, compares the three-month Treasury bill yield to yields on five- and 10-year Treasury notes. Based on his time span of a full quarter, the yield curve has not fully inverted for the full third quarter. The average quarter-to-date yield for the three-month T-bill was 2.68% as of yesterday. It was 3.13% for the five-year note and 3.02% for the 10-year note. Harvey says a very flat curve “suggests slower growth.”
Others plot the two-year Treasury note yield against the 10-year note. Currently, this relationship is inverted. The average quarter-to-date yield for the two-year note is 3.28%, above that of the 10-year note. If you look at the daily data instead, the curve is clearly inverted, with the two-year note yielding 4.02% yesterday, well above the 10-year note’s yield of 3.51%—a recessionary signal.
The FOMC, for its part, cut its full-year projection for real (inflation-adjusted) gross domestic product (GDP) growth. Real GDP is now forecast to be up 0.2% for the year. In June, the FOMC projected 1.7% growth. Federal Reserve chairman Jerome Powell acknowledged that the “chances of a soft landing diminish” with how restrictive monetary policy becomes. And we know the FOMC doesn’t have a good record of achieving soft economic landings. Still, a recession is not guaranteed; only the risks of one occurring have increased.
There are upsides and downsides. We’re earning more interest on our savings accounts and bond yields are juicier than they have been in a long while. Stock valuations are also lower than they’ve been in recent years. The negatives include slower-than-anticipated economic growth, the potential for (but not the probability of) more downside for the stock market and higher borrowing costs for both consumers and corporations.
Most importantly, you still have options available to you. They range from cutting back on spending to being opportunistic in seeking higher yields on savings accounts and bonds as well as stocks whose valuations have fallen to attractive levels. Even in times when clouds seem to be gathering, there are opportunities for savvy savers and investors.

-
It’s Been Difficult for the Fed to Pull Off Economic Soft Landings
Most prior rate-hike cycles have been followed by recessions, so-called hard landings. Only one of the 11 previous rate-tightening cycles has resulted in a perfect soft landing. -
Fixed-Income Risks and Opportunities in a Rising-Rate Environment
Given recent interest rate increases, many bonds and preferred stocks are now offering attractive yields. -
Preferred Stocks Explained
As a hybrid security, preferreds have higher yields than bonds and offer an attractive risk/return tradeoff for investors searching for yield. -
Expense Ratios Can Make or Break Your Portfolio
Rolling over an employer-sponsored 401(k) retirement account into an IRA that offers the same mutual funds often leads to lower overall returns. -
Is Your Mutual Fund Tax-Efficient?
Minimizing the taxable distributions of a mutual fund can boost investors’ aftertax returns.
AAII Sentiment Survey
The latest AAII Sentiment Survey shows that the percentage of individual investors describing their six-month outlook for stocks as “bearish” rebounded to its highest level since 2009. Plus, this week’s bullish sentiment reading ranks among the 20 lowest in the survey’s history.
Bullish sentiment, expectations that stock prices will rise over the next six months, pulled back by 8.4 percentage points to 17.7%. As noted above, this is among the 20 lowest readings in the survey’s history, which dates back to 1987. Optimism was last at a similar level in May.
Bullish sentiment remains below its historical average of 38.0% for the 44th consecutive week. Bullish sentiment is also unusually low for the fourth consecutive week and the 27th time in 38 weeks. The breakpoint between typical and unusually low readings is currently 27.6%.
Neutral sentiment, expectations that stock prices will stay essentially unchanged over the next six months, decreased by 6.5 percentage points to 21.4%. Neutral sentiment is below its historical average of 31.5% for the 20th time in 22 weeks. It is also at an unusually low level. The breakpoint between typical and unusually low readings is 23.1%.
Bearish sentiment, expectations that stock prices will fall over the next six months, rose sharply by 14.9 percentage points to 60.9%. Pessimism was last higher on March 5, 2009 (70.3%). Bearish sentiment is above its historical average of 30.5% for the 43rd time out of the past 44 weeks and is at an unusually high level for the 28th time out of the last 36 weeks. The breakpoint between typical and unusually high readings is currently 40.5%.
The bull-bear spread (bullish minus bearish sentiment) is –43.1% and is unusually low for the 29th time in 35 weeks. This week’s reading ranks among the sixth most negative in the survey’s history. The breakpoint between typical and unusually low readings is currently –10.9%.
Historically, the S&P 500 index has gone on to realize above-average and above-median returns during the six- and 12-month periods following unusually low readings for bullish sentiment and the bull-bear spread. Unusually high bearish sentiment readings historically have also been followed by above-average and above-median six-month returns in the S&P 500. The S&P 500 has underperformed following periods of below-average neutral sentiment, though the link is weaker.
Continued volatility in the major stock indexes along with inflation, corporate earnings, monetary policy and increased chatter about the possibility of a recession are all likely weighing on individual investors’ short-term expectations for the stock market. Also influencing sentiment are politics and the ongoing invasion of Ukraine by Russia.
Bullish: 17.7%, down 8.4 points
Neutral: 21.4%, down 6.5 points
Bearish: 60.9%, up 14.9 points
Bullish: 38.0%
Neutral: 31.5%
Bearish: 30.5%
See more Sentiment Survey results.

September 15, 2022 Profit Margins Have Gained in Importance
September 8, 2022 401(k) Tips and Useful Information
September 1, 2022 New Innovations: Single Stock and BuyWrite Bond ETFs
August 25, 2022 The Large-Cap Equity Premium Has Become Less Persistent

Discussion
Barry J from TX posted over 4 years ago:
Charles, thanks for all the data points, trends and comparisons on a key investing decision factor – interest rates - that has increasing prominence among the many, many datapoints investors need to follow as they navigate the course of their portfolios in a perilous economy. I know there is a camp out there (populated by some very successful investing role models, including John Bogle) that says only look at your portfolio once year. They say this bring you peace of mind and reduces behavioral cognitive dissonance. Very true for the passengers on the aircraft. No so for the crew. The cockpit crew has a lot of dials and levers to follow, but the vital few that will kill everyone are altitude, airspeed, and fuel. To stretch this analogy a bit, Powell is the pilot (the voice on the intercom), FOMC is the copilot (actually moving the throttles), and individual investors are the folks in the economy coach seats (sleeping after the inflight meal and a few celebratory drinks). When the pilot gets on the intercom and characterizes the possibility of a “soft landing” – “I wish there was a pleasant way to do that. There isn’t.” as Powell did yesterday, and does NOT MENTION a “soft landing” as Powell did yesterday, like he did earlier in the flight, all passengers should heed that message and put their seat belts back on. Or as Bette Davis famously warned her party guests in “All About Eve” (1950), “Fasten your seat belts, it's going to be a bumpy night.” Charles’ “fully expository” version of Bette’s pithiness says everything Bette said without the “camp” attitude. Thank you, Charles.
Tom T from NJ posted over 4 years ago:
Charles - how is the breakpoint between "typical" and "unusually high/low" readings calculated?
Charles M Rotblut from Illinois posted over 4 years ago:
Hi Tom,
We use standard deviation to determine the breakpoints between typical and unusually high/low readings in the sentiment survey. Any reading that is more than one standard deviation above or below the median is considered unusual.
-Charles
John L from NJ posted over 4 years ago:
Charles - One standard deviation plus or minus includes about 68% of the normal distribution. By your standard 32% of the time the sentiment reading is unusually high or low. Seems like you are stretching the definition of "unusual".
You need to log in as a registered AAII user before commenting.
Create an account