

Why Some Swings in Market Sentiment Matter More Than Others
by Charles Rotblut | July 17, 2025
I like to describe market sentiment as a pendulum. Sentiment swings back and forth between being optimistic, neutral and pessimistic. The sentiment pendulum swings within a typical range two-thirds of the time. Such swings are interesting to watch, but are simply normal fluctuations.
On occasion, sentiment shifts enough to pull the pendulum further in one direction or the other. This often happens when other indicators of the market mood also start signaling high levels of fear or greed. Such occurrences are worth paying attention to because the pendulum will swing back in the opposite direction—often quickly.
We have seen this occur time and time again with the AAII Investor Sentiment Survey (and other measures of sentiment). When pessimism dominates the survey’s results, sellers have likely exhausted themselves, setting the stage for rebounds. Conversely, extreme optimism often precedes pullbacks in the S&P 500 index as the pool of buyers shrinks significantly.
Our past analysis of the AAII Investor Sentiment Survey results found that the S&P 500 outperforms (underperforms) whenever a bullish sentiment reading ranks in bottom (top) 16% of all readings. An opposite relationship exists with high and low bearish sentiment (stocks outperform and underperform, respectively). Such benchmarks work well as a rule, but my colleague Wayne Thorp found that using a percentile ranking system works even better as a sign to keep an eye out for a market turnaround.
The new AAII Contrarian Sentiment Indicator ranks our current investor sentiment against historical levels to identify directional bias (bullish versus bearish sentiment) and measure the proportion of bullish, bearish and neutral opinions. It uses a rolling percentile ranking system to adjust to changing market regimes.
AAII Contrarian Sentiment Indicator: Neither Too Hot Nor Too Cold
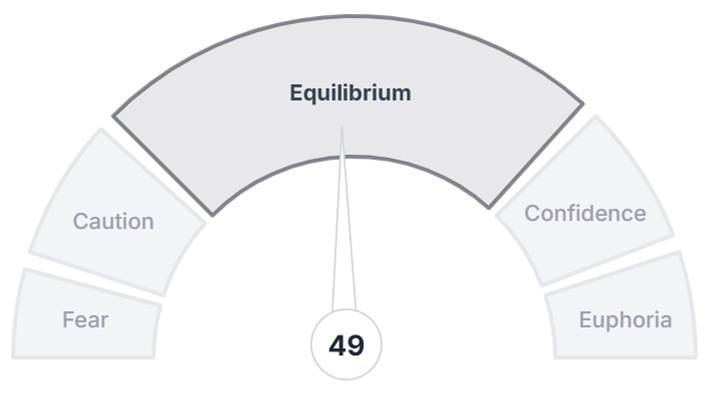
Source: AAII Sentiment Investing. Data of 7/16/2025.
The adjustments made by the rolling ranking system are necessary because both the averages and the border separating typical and unusual readings shift over time.
Using a rolling percentile ranking system also acknowledges that structural shifts can take place in investor sentiment. For example, from 1987 through 2010, bullish sentiment above 50.0% accounted for 16.5% of all weekly readings. Since 2010, that has dropped to less than 5.0%. Using static thresholds would miss that potential structural shift. What was considered only moderately bullish 10 or 15 years ago may be extremely bullish today if a true structural shift has taken place in investor sentiment.
As I pointed out last week, objectively identifying the current level of investor sentiment helps you determine the market’s mood and when to keep an eye out for a market turnaround. Combining investor sentiment with additional indicators to form a broader mosaic allows you to spot opportunities to pick up stocks at bargain prices, take profits in stocks trading at high valuations, rebalance your portfolio or make a Roth individual retirement account (IRA) rollover at an opportune time.
Our new AAII Contrarian Sentiment Indicator allows you to quickly identify the current level of investor sentiment.
To celebrate the launch of AAII Sentiment Investing, we’re offering an exclusive limited-time discount for AAII members—now just $97 for one-year access (a $199 value). This powerful new platform features not only the AAII Contrarian Sentiment Indicator but over 10 other indicators. Presented on an easy-to-use dashboard, they measure investor and market sentiment as well as market breadth, volatility, trends and valuation.
As you just read, not all sentiment swings are created equal. When sentiment moves beyond its normal range, history shows that a sharp market reversal often follows. AAII Sentiment Investing helps answer one of the most important questions any investor can ask: Where is the crowd positioned emotionally, and what does that mean for forward-looking risk and opportunity?
Be among the first to use our new data-driven Sentiment Dashboard.
Sign up now for just $97 ($199)

-
Incorporating Investor Sentiment Into Your Portfolio Decisions
There is a long-running link between investor sentiment, like the AAII Sentiment Survey, reaching unusual levels and the market changing direction. -
Analyzing the AAII Sentiment Survey Without Hindsight
Based on the values that existed at past periods of time, above-market returns occurred after unusually high levels of neutral and low levels of bullish sentiment. -
Identifying Future Economic Changes With the Yield Curve
The Treasury yield curve inverts when investors foresee weaker economic conditions ahead, as explained in the July 2025 AAII Journal.
AAII Sentiment Survey
Pessimism among individual investors about the short-term outlook for stocks increased in the latest AAII Sentiment Survey. Meanwhile, optimism and neutral sentiment decreased.
Bullish sentiment, expectations that stock prices will rise over the next six months, decreased 2.1 percentage points to 39.3%. Bullish sentiment is above its historical average of 37.5% for the third time in eight weeks.
Neutral sentiment, expectations that stock prices will stay essentially unchanged over the next six months, decreased 1.2 percentage points to 21.8%. Neutral sentiment is below its historical average of 31.5% for the 52nd time in 54 weeks.
Bearish sentiment, expectations that stock prices will fall over the next six months, increased 3.4 percentage points to 39.0%. Bearish sentiment is above its historical average of 31.0% for the 33rd time in 35 weeks.
The bull-bear spread (bullish minus bearish sentiment) decreased 5.5 percentage points to 0.3%. The bull-bear spread is below its historical average of 6.5% for the 23rd time in 24 weeks.
This week’s special question asked AAII members how, if at all, they changed their approach to investing recently.
Here is how they responded:
- I’ve become much more conservative/cautious: 19.1%
- I’ve become slightly more conservative: 19.8%
- I’ve switched around some investments, but only made modest changes overall: 26.2%
- I’ve become more aggressive: 9.9%
- No changes: 25.1%
Bullish: 39.3%, down 2.1 points
Neutral: 21.8%, down 1.2 points
Bearish: 39.0%, up 3.4 points
Bullish: 37.5%
Neutral: 31.5%
Bearish: 31.0%
See more Sentiment Survey results.

July 10, 2025 Combining Indicators to Better Assess the Market's Mood
July 3, 2025 The State of the U.S. Financial Markets as of Midyear 2025
June 26, 2025 The Case for Free Cash Flow in Stock Selection
June 19, 2025 June Charts of Interest: Tariffs Are Driving Prices Bananas

Discussion
Barry from Texas posted about 1 year ago:
Charles, Wayne, and the unnamed AI Robot, thanks for inviting me to be on this great adventure. #1 For those who have not read the 80 pages of documentation provided to explain this offering, here’ an overview of what I have learned so far (through week 3). #2 There are 13 indicators on the dashboard: 4 for AAII Investor Sentiment and 9 Market Indicators – Structure (3), Sentiment (2), Breadth (3), Volatility (1), Trends (1), and Valuation (3). #3 Each week, I receive an update on the HISTORY, SIGNIFICANCE, TRENDS, and the future PROBABILITIES for each indicator. #4 The updates include an AI-generated update reviewed by AAII. (I vote for “Garth” as the name for the AAII AI bot since it only exists in Wayne’s World. Party on!!!) #5 I find the probabilities for future indicator trends based on historical performance to be highly valuable to understanding the potential directions the overall market might take near term. #6 I have doubts about the representativeness of the AAII sentiment database. The AAII sentiment voter sample size is SMALL for a sample space of 130,000. Small samples are prone to being inaccurate; their standard deviations are LARGE. In Thinking, Fast and Slow, Dan Kahneman discusses his "Law of SMALL Numbers" and the human tendency to overgeneralize and find causes based on small, potentially unrepresentative samples. A representative bias can lead to the mistaken belief that small samples closely resemble the population from which they are drawn, and that future small samples will also be representative. “Taint so, McGee.” #7 Conversely, the 9 market indicators come from a LARGE and contemporaneous sample space (billions of data points over the last 40-year history) and ALL 9 are widely used by reliable market prognosticators at large market firms like SCHW, FID, MORN, etc.). #8 The market indicators avoid most of the esoteric Technical Analysis trend indicators and keeps the ones that are mostly widely followed. #8 The weekly reports are a lot of reading, but a summary dashboard is provided. #9 BENEFIT SUMMARY: PRO: After I read the update, my confidence in these data is reinforced because it comes from AAII. CON: Never forget that this is Mr. Market we are trying to understand. #10 Reread Cowles (market predictions), Graham (value investing), Malkiel (market randomness), Cloonan (long-term investing), Buffett (value investing), Seigel (equity premiums), or any other source on the DANGERs of trying to understand Mr. Market. I think these luminaries will put the value of the AAI offering in perspective. The AAII Sentiment-Market program has already helped me understand how all the moving parts interact and helps me make informed portfolio allocation and diversification decisions. Thank you, Wayne and “Garth.” Excellent. Party on!!! Regards.
John L from NJ posted about 1 year ago:
"objectively identifying the current level of investor sentiment helps you determine the market’s mood and when to keep an eye out for a market turnaround" Sounds like market timing! Not a good idea in my opinion. Investing is a long term activity. Heat chasers and market timers, but I repeat myself, have very poor long term results.
You need to log in as a registered AAII user before commenting.
Create an account