

Combining Indicators to Better Assess the Market's Mood
by Charles Rotblut | July 10, 2025
Last week’s AAII Investor Sentiment Survey showed a potential breakthrough for optimism. The percentage of AAII members describing their outlook as bullish exceeded 40% for the first time since January. (It stayed above 40% this week too.)
Unusually high or low levels of optimism and pessimism have preceded market turning points over the past 40 years. At each point, there were also other signs suggesting a change in market direction could be forthcoming.
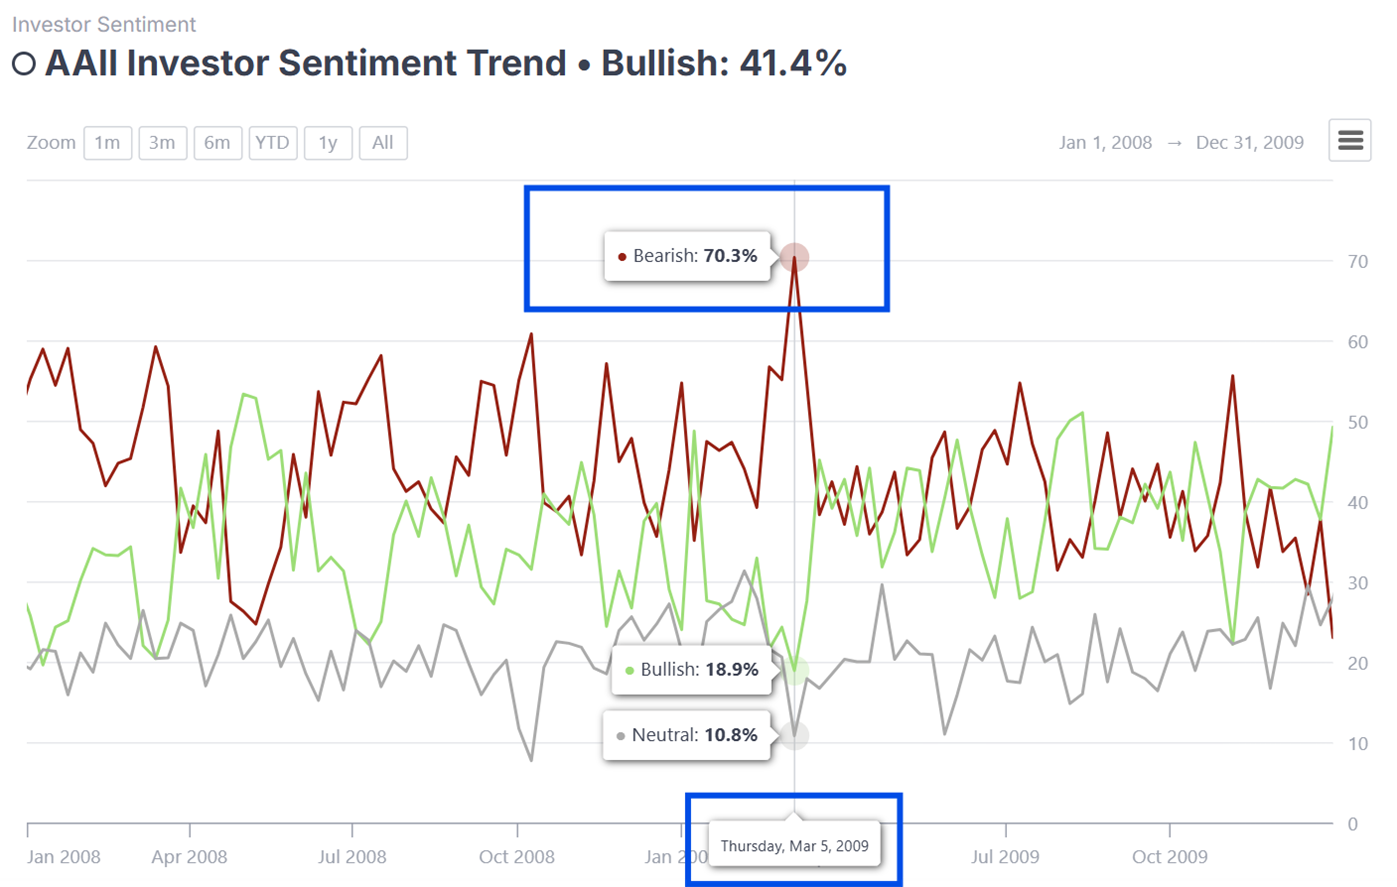
Consider what we observed in March 2009 at the bottom of the global financial crisis. The severe bear market at that time drove bearish sentiment up to a record high of 70.3%. Robert Shiller’s cyclically adjusted price-earnings (CAPE) ratio showed the S&P 500 index trading at a multiyear low of 13.3 times inflation-adjusted 10-year earnings. The CBOE Volatility Index (VIX) remained above 40—a level it had never reached prior to the global financial crisis. The very high VIX reading was a reflection of traders continuing to price a very high level of implied volatility into options contracts.
Source: AAII Sentiment Investing.
To contrarian investors, this combination of indicators was a sign to keep an eye out for a market turnaround. A few days after bearish sentiment hit a record high in the AAII Investor Sentiment Survey, the S&P 500 began the longest bull market in its history.
Any single indicator can give a false signal, be early or come late. This is why forming a broader mosaic is important for determining the market’s current mood and whether it is showing signs of potentially changing. A broader mosaic of the market’s mood helps you to ignore the chatter about “what you ‘should’ be doing now” and focus on decisions that are best for your portfolio.
Consider last week’s rise in optimism. Other indicators pointed to more bullish conditions too.
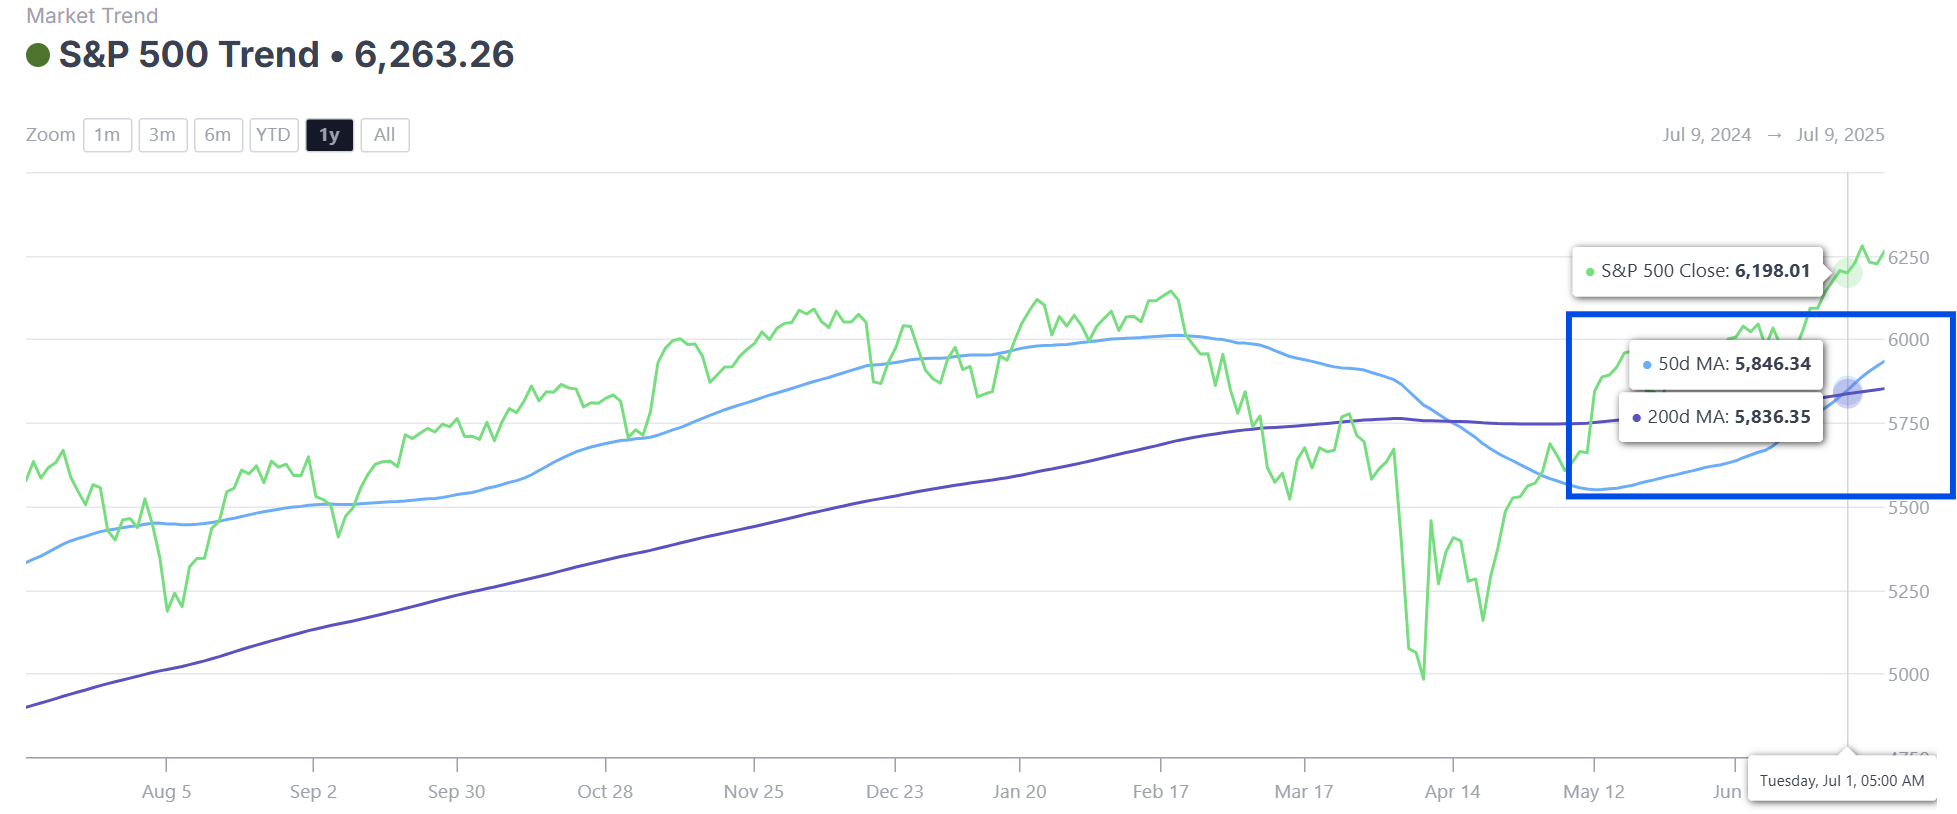
The S&P 500’s trend entered a positive state last week, with its 50-day moving average crossing over its 200-day moving average (aka “a “Golden Cross”). The 50-day moving average plots the S&P 500’s average price for the past 50 days. The 200-day moving average plots the index’s average price for the past 200 days. More recent buying pressure pushes the shorter-term average above the longer-term average.
Source: AAII Sentiment Investing.
At the same time, the Short Interest Diffusion Index (SIDI) showed the lowest number of defensive positions being held by institutional investors in over one year. The SIDI tracks whether current short interest positions (stocks sold short) are below, equal to or above each stock’s one-year average. It is a market-capitalization-weighted measure just like the S&P 500. Lower numbers signal that institutional investors are less fearful about a forthcoming drop in stock prices.
The VIX also shows a reduced level of fear. Often called the “fear index,” the VIX tracks the level of implied volatility priced into option contracts. Lower levels of implied volatility signal expectations by options traders that the stock market will be relatively calm over the next 30 days. At its current level, the VIX is in a neutral state after having spiked significantly following the April tariffs announcements.
These are just a few of the indicators we combine with the results of the AAII Investor Sentiment Survey to form a broader picture of the market’s mood in AAII Sentiment Investing.
We wanted to build something meaningful that would help investors not only use sentiment insights alongside their current strategy, but also teach them how to interpret and apply sentiment data, which many tools on the market tend to overlook.
The resulting dashboard is the result of months of care and collaboration from our team, and we’re proud to share it with you.
If you’d like to explore what we’ve built, we’re offering a special introductory discount just for Investor Update readers! Simply use the promo code CRSENT at checkout to get $50 off, with a 30-day money-back guarantee.
No pressure, just an open invitation to see if AAII Sentiment Investing can help you make more informed decisions in 2025 and beyond.
The promo code for this $50 discount expires on July 12 at midnight Central Time.

-
Navigating Market Cycles With Shiller’s CAPE Ratio
The CAPE ratio empowers long-term investors to navigate volatile markets, forecast returns and make smarter decisions grounded in historical valuation trends. -
Understanding the VIX: A Practical Guide
The VIX is a widely watched metric that tracks expected volatility in the stock market. How you can use it to gauge potential market turning points. -
Robo-Advice Update for 2025: Continued Consolidation and Greater Customization
With the initial wave of users onboarded, leading robo-advisers are shifting their focus to profitability.
AAII Sentiment Survey
Optimism among individual investors about the short-term outlook for stocks decreased in the latest AAII Sentiment Survey. Meanwhile, neutral sentiment and pessimism increased.
Bullish sentiment, expectations that stock prices will rise over the next six months, decreased 3.6 percentage points to 41.4%. Bullish sentiment is above its historical average of 37.5% for the second time in seven weeks.
Neutral sentiment, expectations that stock prices will stay essentially unchanged over the next six months, increased 1.1 percentage points to 23.0%. Neutral sentiment is below its historical average of 31.5% for the 51st time in 53 weeks.
Bearish sentiment, expectations that stock prices will fall over the next six months, increased 2.5 percentage points to 35.6%. Bearish sentiment is above its historical average of 31.0% for the 32nd time in 34 weeks.
The bull-bear spread (bullish minus bearish sentiment) decreased 6.2 percentage points to 5.7%. The bull-bear spread is below its historical average of 6.5% for the 22nd time in 23 weeks.
This week’s special question asked AAII members how the stock market’s year-to-date return compares to their expectations at the start of 2025.
Here is how they responded:
- It is better than expected: 55.2%
- It is about as I expected: 32.3%
- It is worse than expected: 9.7%
- Not sure/other: 2.8%
Bullish: 41.4%, down 3.6 points
Neutral: 23.0%, up 1.1 points
Bearish: 35.6%, up 2.5 points
Bullish: 37.5%
Neutral: 31.5%
Bearish: 31.0%
See more Sentiment Survey results.

July 3, 2025 The State of the U.S. Financial Markets as of Midyear 2025
June 26, 2025 The Case for Free Cash Flow in Stock Selection
June 19, 2025 June Charts of Interest: Tariffs Are Driving Prices Bananas
June 12, 2025 Don't Mistake MicroStrategy's 10% Preferred Yield for Pure Bitcoin Exposure

Discussion
Barry J from TX posted over 1 year ago:
Charles, as Gover Pyle would say, Golly! Shazam! Surprise, surprise, surprise!!! #1 Please unchain Wayne from his computer. #2 This Combined Sentiment-Price Cockpit Dashboard offering looks very good. It downloaded to about 80 pages, so I haven't read the whole package yet. #3 My first thought that this "cockpit" of indicators could really (there's Gomer again) help AAIIers learn how to use the SIGNALING closest to market indicators to fine tune their portfolio strategy. #4 I am frugal to a fault, but this offering looks interesting. So much to learn. #4 I get back to you soon. I may have $199 to invest here. l can use some of the money I saved by NOT buying ANY of the tons of Trump tchotchkes I get emails on everyday. How many hats does one person need to be in one parade?
Kevin M from Ohio posted about 1 year ago:
Charles, The Sentiment Insights (SI) and Dashboard looks very good. A great addition to my Platinum subscription. Thanks to the AAII team. I have only spent about 45 minutes seeing and understanding what is in SI and already learning that "SI" could be "solid info" for me to look at each week. Leveraging this tool on sentiment within my 401k, IRAs and Roths can be a great way to improve lifetime returns. For taxable brokerage accounts - I still need to be careful on triggering gains. I expect that the SI Dashboard and Insights will be valuable educational reading each week.
Barry from Texas posted about 1 year ago:
Charles, #1 I downloaded the tutorial. It formatted out to 80 pages. #2 I feel like the amiable, philosophical, personable “everyman” Pogo Possum wading into the nearby Okefenokee Swamp on a great adventure. The swamp is not as deep as I expected (13 indicators), but it's still a tangled swamp. I counted 3 expectations in the OV. (A) Learn how to recognize and use the SIGNALS investor SENTIMENT and MARKET trends can provide (that's the 13 indicators). (B) I haven’t yet met all the resident creatures [market indicators] that could help/hurt me survive/benefit (C) Perhaps the IIS course will provide a way for users to collect and use data to improve performance. #2 My first observation from what I have read so far is that I don’t see any way to CALIBRATE improvements in skills using these signals other than increasing returns. #4 Maybe you might want to read U PA’s Phillip Tetlock’s "Superforecasting: The Art and Science of Prediction." The lesson Tetlock found in his project to identify "expert" forecasters was that you need ways to estimate and calibrate your efforts when you are attempting to forecast the magnitude and timing of future states. #5 Dan Kahneman and Amos Tversky conducted multiple experiments with many age groups to measure their ability to estimate probabilities. Diverse groups, from non-high school graduates to professionals who use everyday to make decisions, were weak at these tasks. #6 Kahneman's Prospect Theory demonstrates that deciding how to seek gains and avoid losses requires controlling our emotions across an “S” shaped curve where probabilities are widely misestimated, and most people tend to round off percentages near both ends of the decision curve. (Sounds similar to an inverted yield curve.) #7 Many of us are unbelievably bad at this task. Limited familiarity with estimating PERCENTAGES and PROBABILITIES -- the two primary SIGNALS ISS uses -- to forecast the CORRELATION and TIME LAGS between SIGNALS and RESULTS comes down to simple "trial and error" guessing … with real money ... while playing against Mr. Market and the nasty, selfish, well-armed, well-trained professional investing crowd he runs with who Gene Fama reminded us have access to the same data sooner than we do. #8 The IIS sounds like a good set of tools to help navigate continuing VOLITILITY and to anticipate and take advantage of market trend turning points. #9 The promo makes it easy to try IIS. I already have feedback on how dumb I am now. I'm in. I accept your offer. IIS may be the best $199 I will spend this year. #10 Thanks for all the work. #11 I look forward to having you and Team AAII teach me something. Very few have achieved this outcome. One teacher told me that teaching me was like trying to teach a pig to sing. It wasted their time and made me angry. Pogo would say, "We have met the enemy and he is us."
You need to log in as a registered AAII user before commenting.
Create an account