

July Charts of Interest: Tech Stocks Are Pricey vs. Other Large Caps
by Charles Rotblut | July 24, 2025
Featured Tickers: NVDA
NVDA
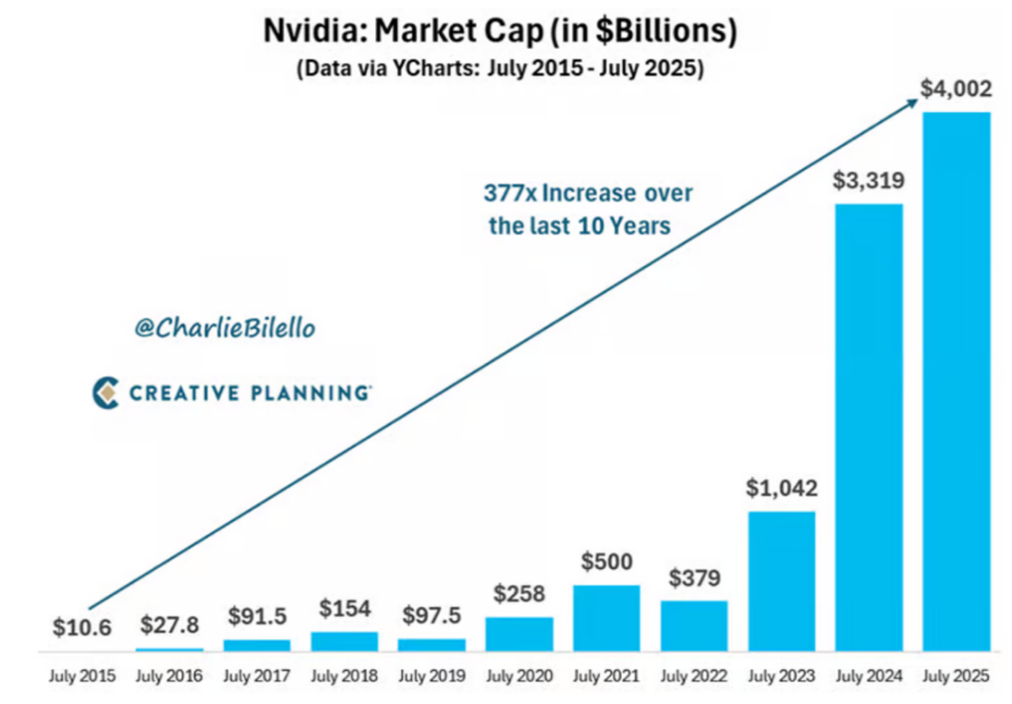
Two weeks ago, Nvidia Corp.  (NVDA) became the first corporation to be worth $4 trillion. This threshold was reached just 13 months after Nvidia became the third company to have a $3 trillion market capitalization.
Nvidia’s market cap has soared over the past two years in response to the accelerated adoption of artificial intelligence (AI).
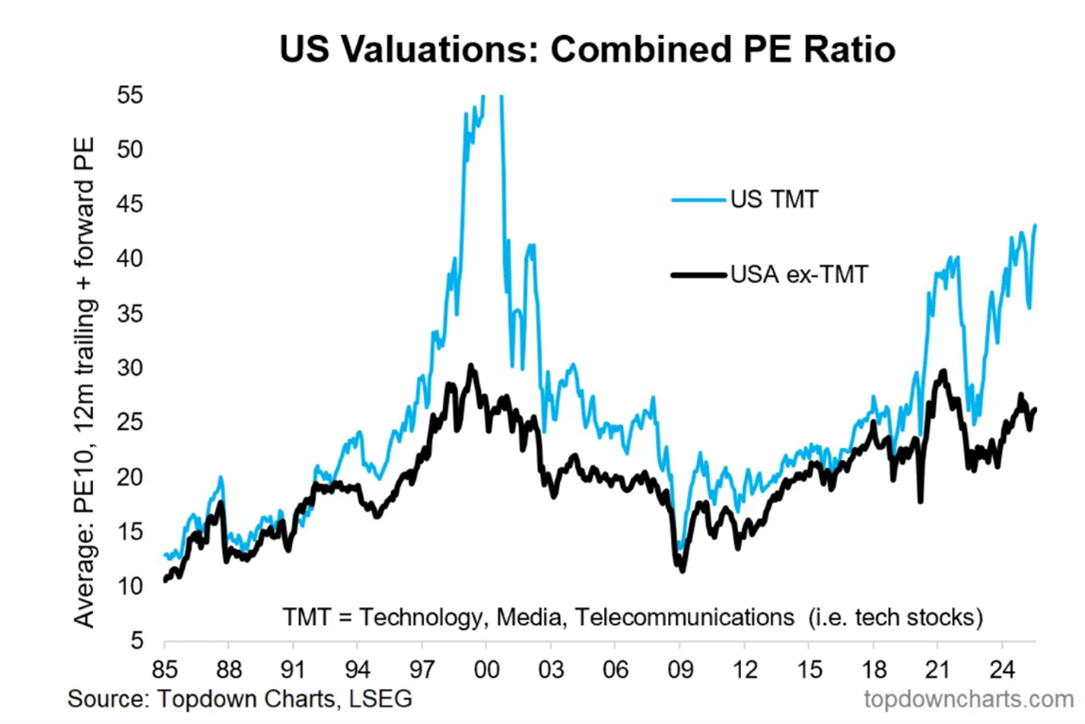
Thanks in part to Nvidia’s soaring value, the valuation premium investors are paying for technology stocks relative to all other large-cap stocks is at a level not seen since the dot-com bubble. In the chart below, technology stocks are defined as technology, media and telecommunications stocks. As Topdown Charts’ Callum Thomas pointed out on his Substack feed, high valuations leave little room for error.
Lower Tech Exposure Is Hurting Mid- and Small-Cap Stocks
I saw several charts this month showing how small-cap stocks were underperforming large-cap stocks. The Russell 2000 index is notably in a prolonged streak of not setting a new record high.
The chart below from the J.P. Morgan Guide to the Markets illustrates part of the problem. The information technology sector accounts for one-third of the S&P 500 index’s market cap. It accounts for just 15% of the Russell 2000’s market cap. Small caps have a more varied sector exposure relative to large-cap stocks. In addition, they are far more tilted to the value factor than their large-cap peers.
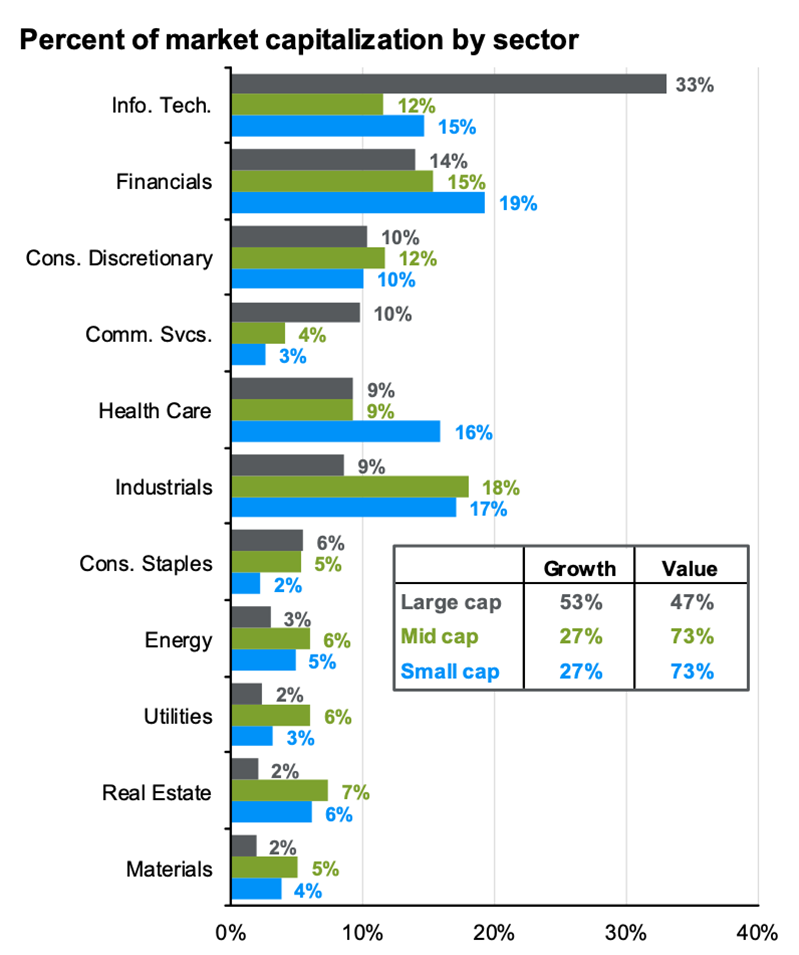
Source: J.P. Morgan Guide to the Markets.
Highest 30-Year Treasury Bond Yields Since 2007
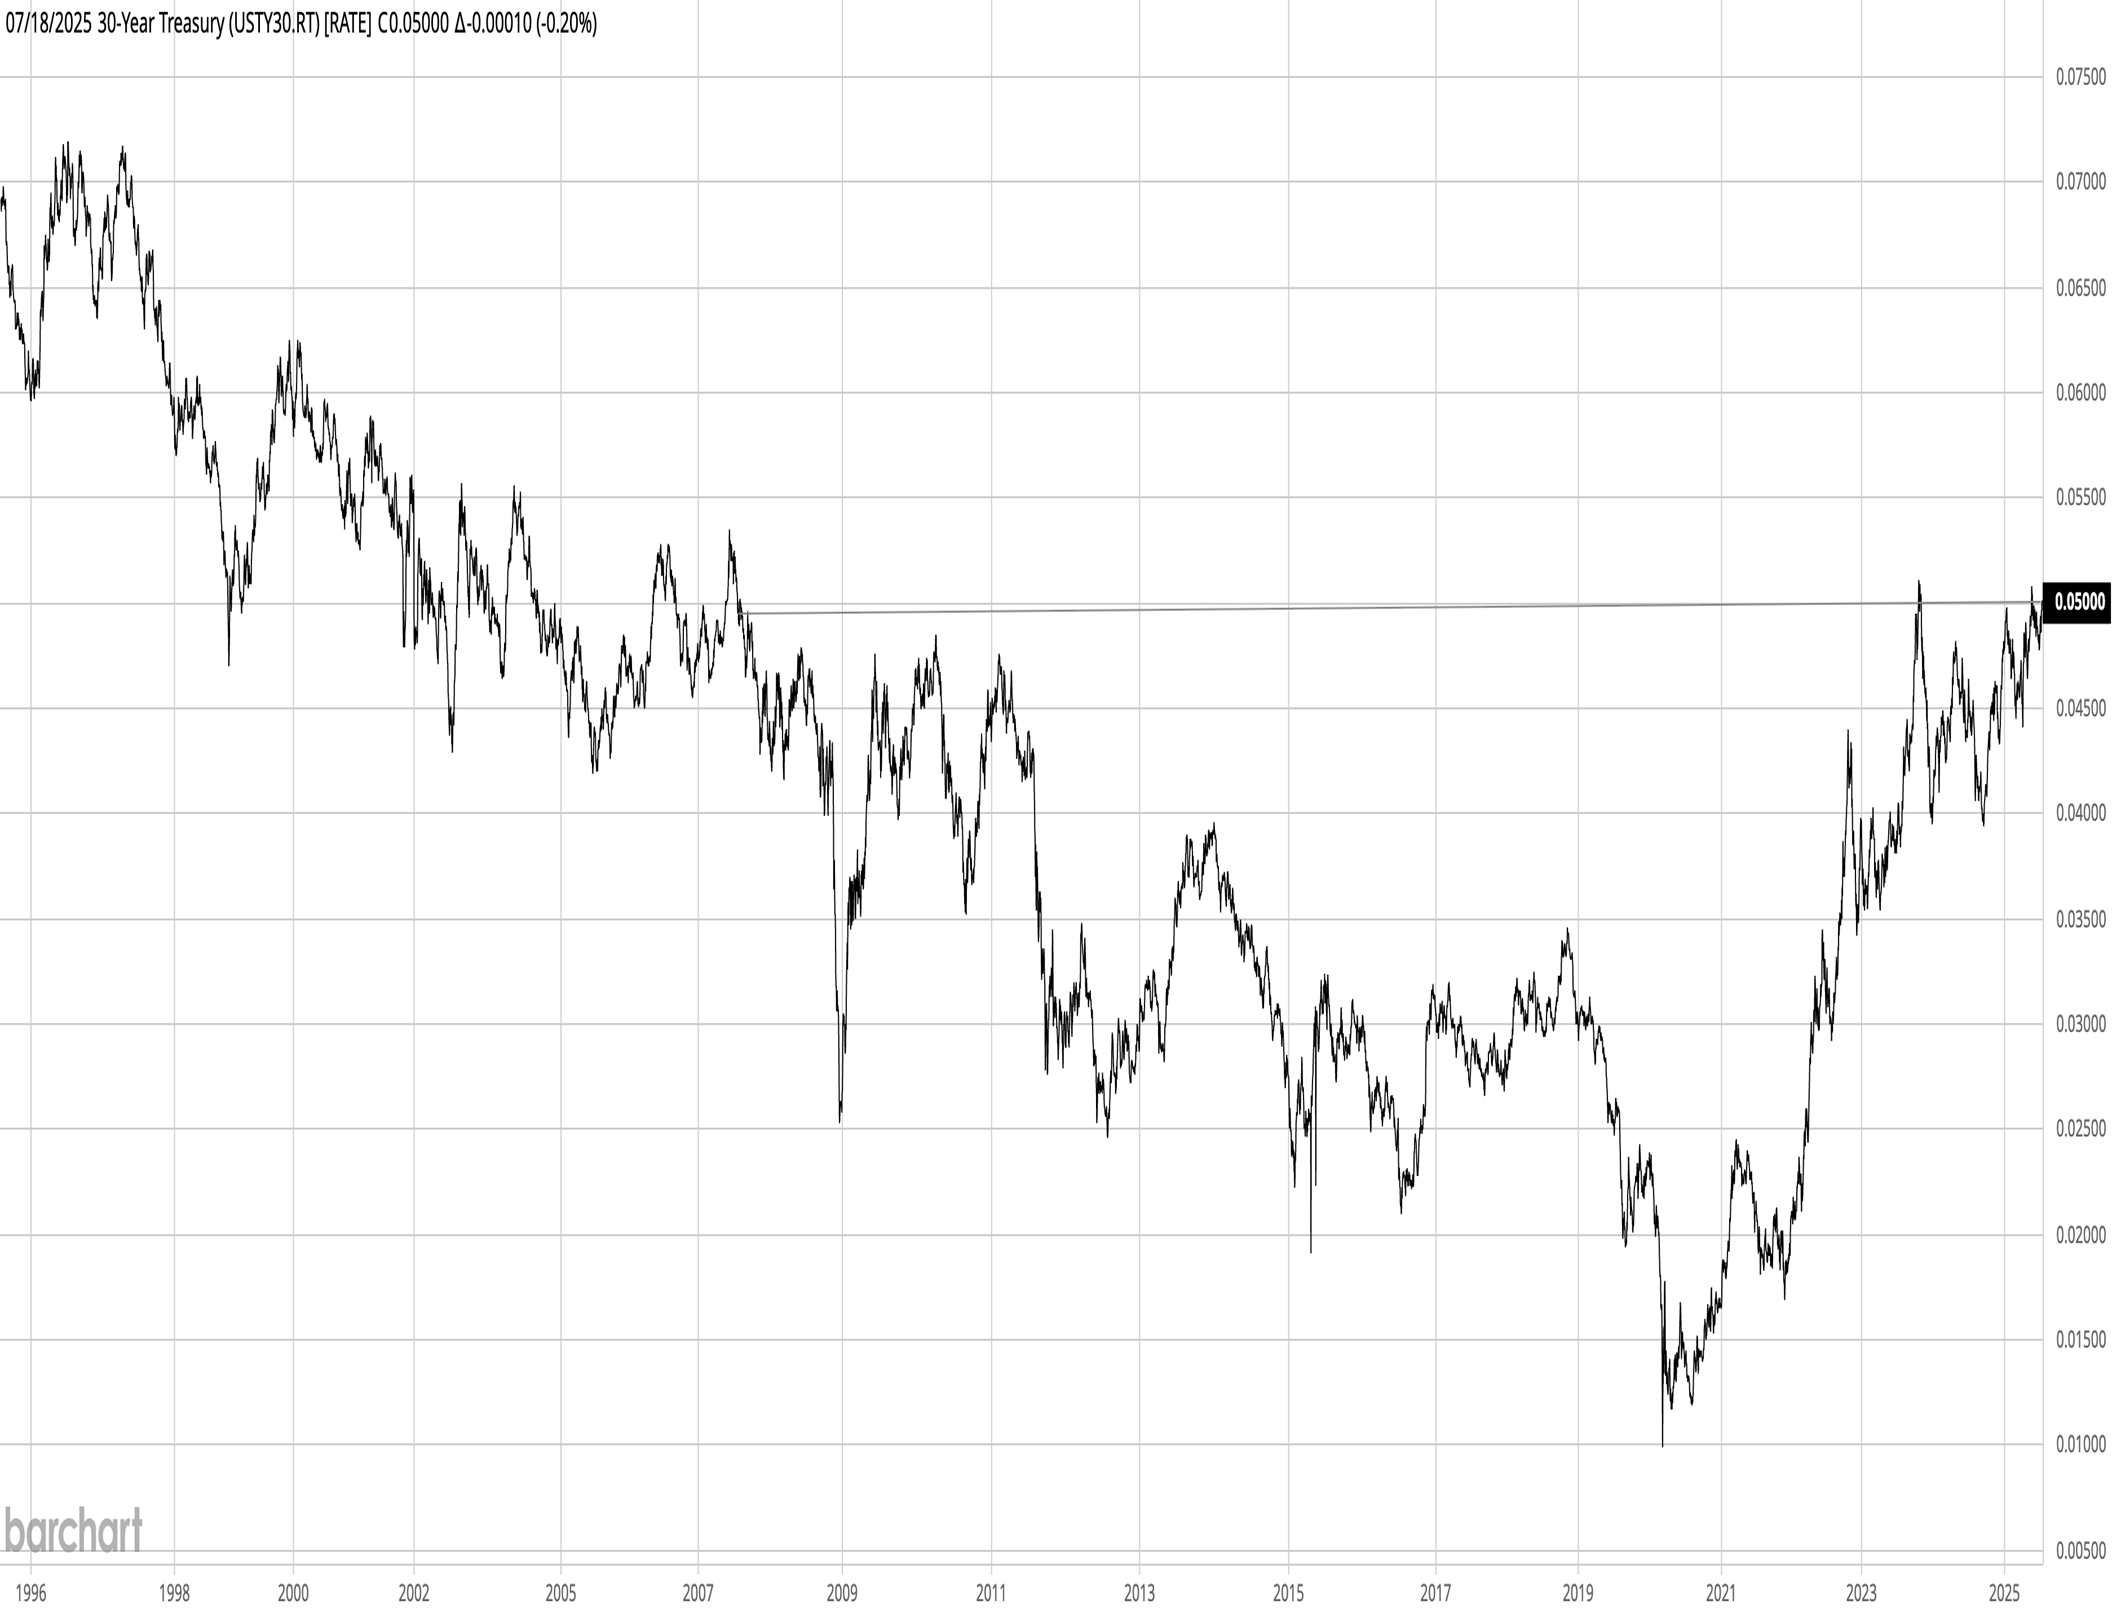
Last week, yields on 30-year Treasury bonds hovered near their highest levels since the summer of 2007. The rise in long bond yields is being attributed to recent tariffs, expectations for inflation to remain sticky/rise, the weaker U.S. dollar and expectations for rising U.S. debt levels. Competition from other investments also plays a role. The chart below is from Barchart.
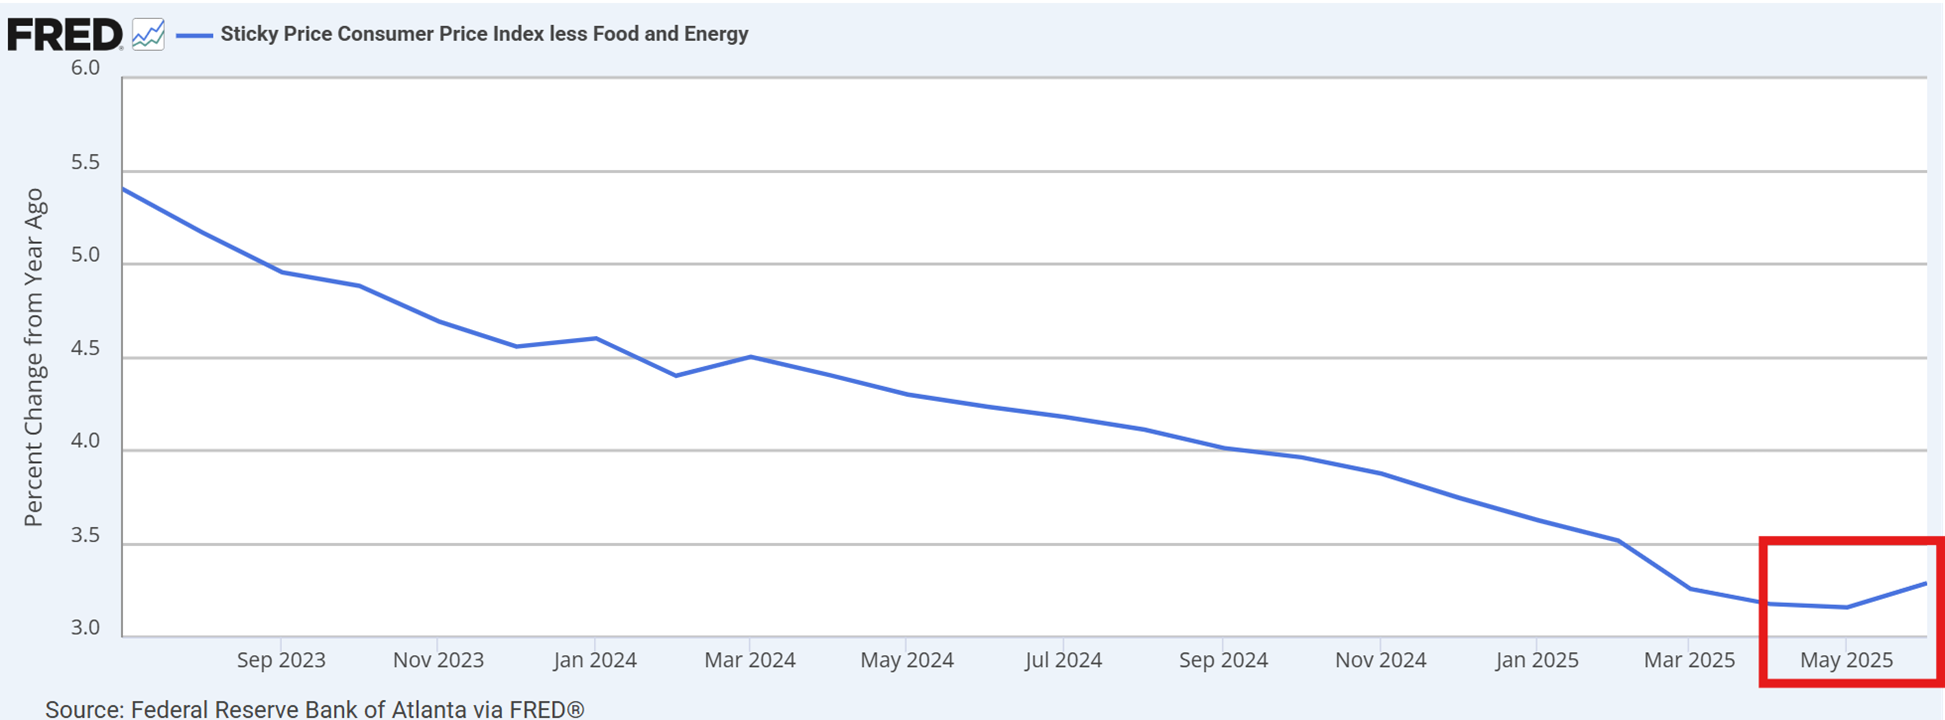
Sticky consumer prices ticked upward in June. These are prices on goods and services included in the consumer price index (CPI) that change relatively infrequently. Tariffs are being blamed, but it is too early to determine if last month was a blip or the start of a new trend.
Individual Investors Have Outperformed Since Tariffs Announced
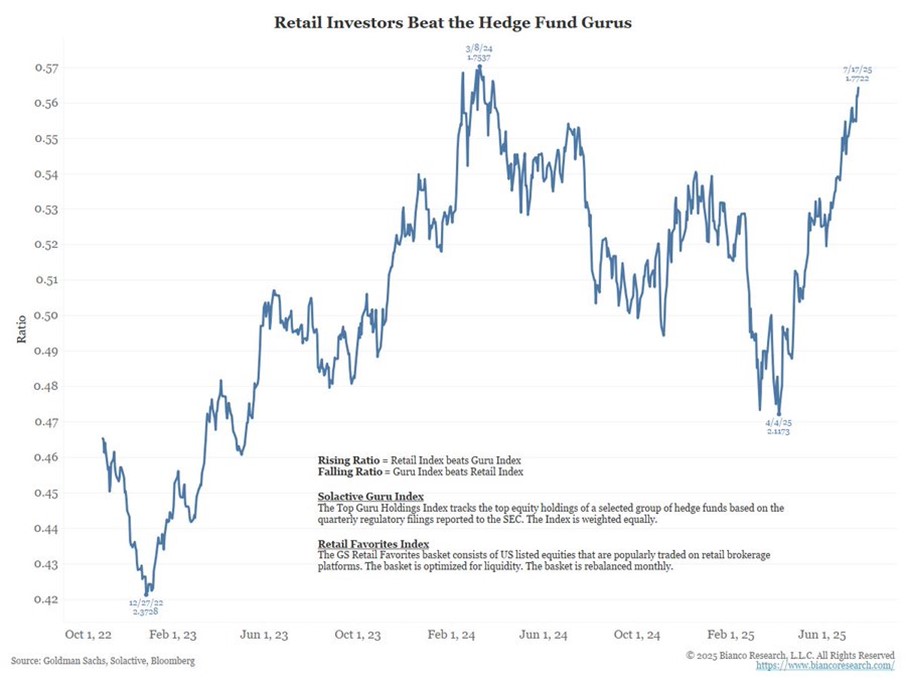
Returns have been higher for individual investors than they have been for hedge funds since early April, according to market strategist Jim Bianco. In the chart below, individual investor returns are tracked based on a basket of stocks that are popularly traded on brokerage platforms. Hedge fund returns are tracked based on a basket of securities held by select firms.
Vanguard: Target-Date Funds Have Boosted Equity Allocations
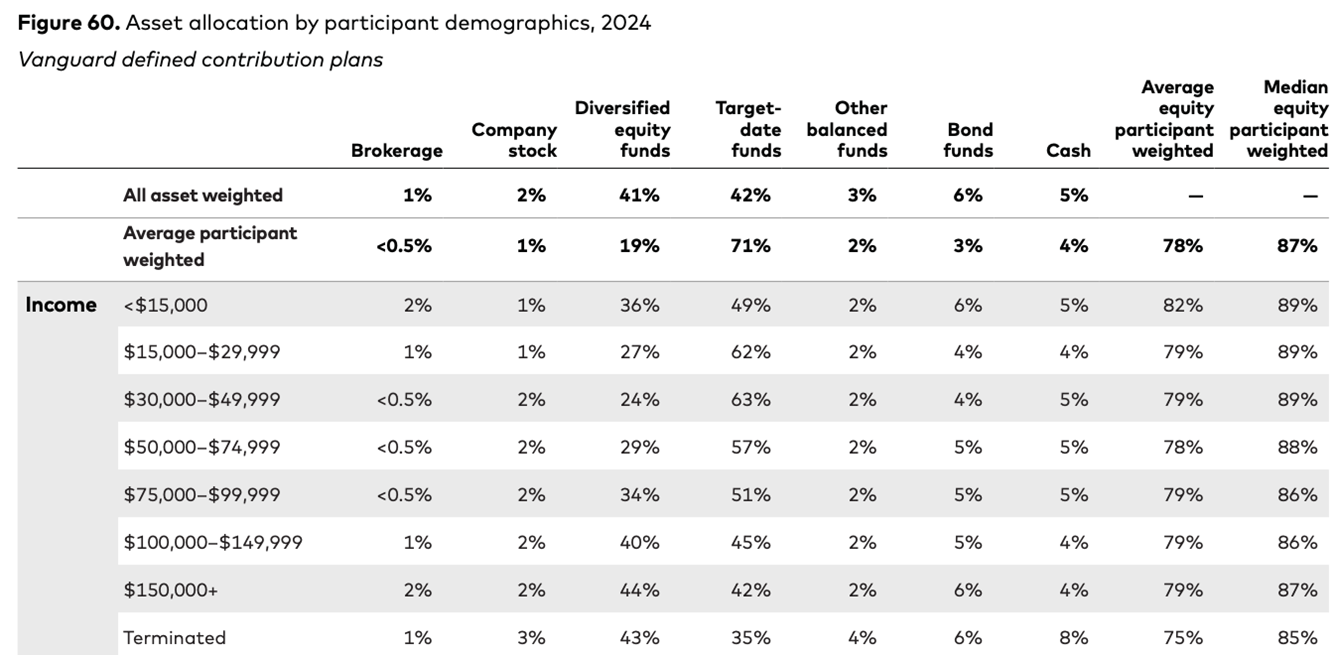
“In the past, higher-income [retirement plan] participants tended to assume more equity market risk, on average, than lower-income participants. However, with the rising adoption of target-date funds and automatic enrollment, participants of all income segments now have similar equity risk,” noted Vanguard in its “How America Saves 2025” report.
Overall, retirement plan equity allocations have been rising over the past 10 years.
Source: Vanguard, “How America Saves 2025.”

-
Should You Buy Bonds When Interest Rates Are Rising?
Whether interest rates are rising or falling, a custom ladder of high-quality bonds will produce a consistent cash flow. -
How Target-Date Funds Work
Understand what you’re investing in and how it fits into your retirement plan when choosing a target-date fund, as variations abound. -
Using Large Language Models for Stock Valuation Analysis
Given structured inputs, artificial intelligence (AI) tools can reproduce the logical framework for DCF valuation and generate multiple scenarios, as explained in the July 2025 AAII Journal.
AAII Sentiment Survey
Neutral sentiment among individual investors about the short-term outlook for stocks increased in the latest AAII Sentiment Survey. Meanwhile, optimism and pessimism decreased.
Bullish sentiment, expectations that stock prices will rise over the next six months, decreased 2.5 percentage points to 36.8%. Bullish sentiment is below its historical average of 37.5% for the first time in four weeks.
Neutral sentiment, expectations that stock prices will stay essentially unchanged over the next six months, increased 7.4 percentage points to 29.2%. Neutral sentiment is below its historical average of 31.5% for the 53rd time in 55 weeks.
Bearish sentiment, expectations that stock prices will fall over the next six months, decreased 4.9 percentage points to 34.0%. Bearish sentiment is above its historical average of 31.0% for the 34th time in 36 weeks.
The bull-bear spread (bullish minus bearish sentiment) increased 2.5 percentage points to 2.7%. The bull-bear spread is below its historical average of 6.5% for the 24th time in 25 weeks.
This week’s special question asked AAII members how they think tariffs will impact economic growth in the second half of 2025.
Here is how they responded:
- They will slow the U.S. economy by a significant amount: 22.8%
- They will slow the U.S. economy by a modest amount: 45.9%
- They will have little/no impact on the U.S. economy: 21.0%
- They will boost the U.S. economy: 6.6%
- Not sure/no opinion: 3.1%
Bullish: 36.8%, down 2.5 points
Neutral: 29.2%, up 7.4 points
Bearish: 34.0%, down 4.9 points
Bullish: 37.5%
Neutral: 31.5%
Bearish: 31.0%
See more Sentiment Survey results.

July 17, 2025 Why Some Swings in Market Sentiment Matter More Than Others
July 10, 2025 Combining Indicators to Better Assess the Market's Mood
July 3, 2025 The State of the U.S. Financial Markets as of Midyear 2025
June 26, 2025 The Case for Free Cash Flow in Stock Selection

Discussion
Barry from Texas posted about 1 year ago:
Charles, you started with a mashup of the current honorees enshrined in COI AAII “wall of worries” we see/hear in daily HLs (fractured markets between LG cap valuations and mid/small caps underperformance, and surging 5% LT USTs returns nearing market returns @ 8%), but the bread crumbs ended when you reviewed the AAII Sentiment Survey results that showed that Fat Albert had sat down on the bearish end of the "AAII fear gauge" seesaw DESTROYING the LEVERAGE markets NEED to REBALANCE to a SHARED PROSPEROUS future. #1 The new kids on the block -- NVDA + M7, the TECH AI oligopoly, COMM sector network effects, and rising revenues lifting stock valuations that have elevated valuations to levels not seen since the 2001 dot-com bubble [a “nudge” to remind us of the first downturn of this Century]. #2 Then, several July COI reports showed that small-caps/value stocks are underperforming in their respective markets. #3 UST30 yields are hovering near-term at the highest levels since 07/07 [a reference to the 2009 second downturn of the Century]. #4 However, these apocalyptic reminders, retirement planning, and equity allocations have been rising over the past 10 years more than fixed income allocations [which envision an inverted yield curve]. LT retirement planning behaviors remained largely unaffected in 2024 [VGD “How America Saves 2025”] #5 How do the prescient AAII Carnacs see all this? TEN TIMES as many AAII Sentiment Survey responses (68.7% vs 6.6%) expect 2025 GDP (the total outputs of good and services) WILL BE “slower” and/or “NON” over the next 6 months ... yet AAII Sentiment Survey data responses suggest “slow a lot @ 22.8% + slow modest @45.9% + Low/None @21.0% that collectively forecast WEAK economic growth throug EOY 2025 ... and the "AAII sentiment survey "seesaw effect" sees NO leverage anywhere as the contradictions keep coming -- the Bull/Bear SPREAD (leverge) is 2.5% (Bulls @36.8% vs Bears @ 34.0%. I guess some of us never learn that the fat kids get bored when the seesaw never rises and just go home, and THIS is the difference that makes all the difference. #6 Can someone tell me how we can use the AAII Sentiment Survey data to ANTICIPATE changes in market sentiment and portfolio rebalancing to ANTICIPATE market momentum. #7 As Desi would say in every episode, “Lucy, “splain” to me why I should let you, Ethel, and Fred be in my show tonight.” Babaloo! #8 My two guesses are (1) the survey uses a voluntary (rather than random) sampling technique that produces non-representative samples. Guess #2 is that the responses reflect "opinions" not aligned with portfolio allocations due to FOMO, YOLO, or "buy-and-hold" has no "REAL" risk, or some other meme.
You need to log in as a registered AAII user before commenting.
Create an account