

August Charts of Interest: Valuations at Dot-Com Bubble Levels
by Charles Rotblut | August 21, 2025
Featured Tickers: IEFA
IYY
IEFA
IYY
This month’s charts of interest starts with a look at valuations for the S&P 500 index, which are at their highest in a quarter-century. We then discuss foreign stocks’ outperformance, before moving on to the flow of investment dollars and the current sentiment of institutional investors. We finish with the current price of owning a home. (Spoiler alert: It’s gotten much more expensive.)
S&P 500 Valuations Are Partying Like It’s 1999
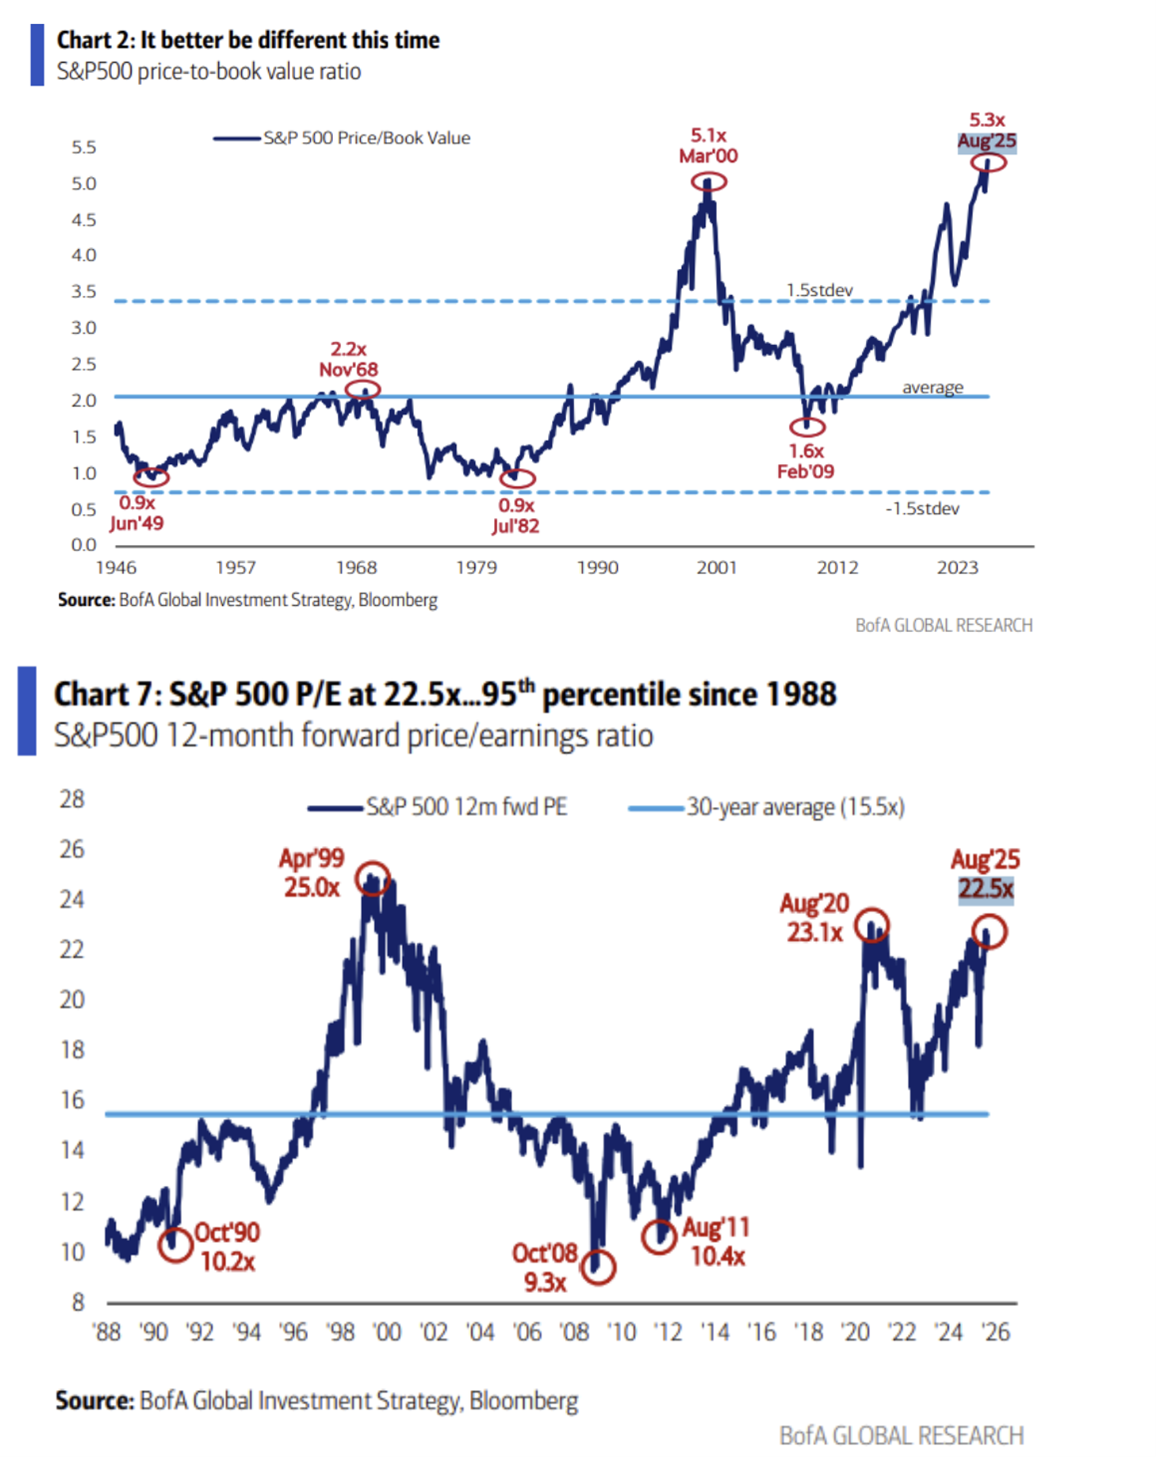
I’ve seen a few people share BofA Global Investment charts about valuations. Here are two charts highlighted in this week’s Financial Samurai newsletter. As you can see, both the S&P 500’s price-to-book-value (P/B) and price-earnings (P/E) ratios are hovering around levels not seen since the dot-com bubble. One big difference between now and the late 1990s is that technology and technology-adjacent companies are profitable—though many currently have frothy valuations.
Foreign Stocks Are Winning So Far This Year
Allocations to foreign stocks have paid off this year. As of midday Thursday, August 21, the iShares Core MSCI EAFE ETF  (IEFA) has gained 24.6%. The iShares Dow Jones U.S. ETF (IYY) is up just 9.2%. iShares Core MSCI EAFE invests in large-, mid- and small-cap developed market equities, excluding the U.S. and Canada. iShares Dow Jones U.S. invests in over 1,000 domestic large- and mid-cap stocks.
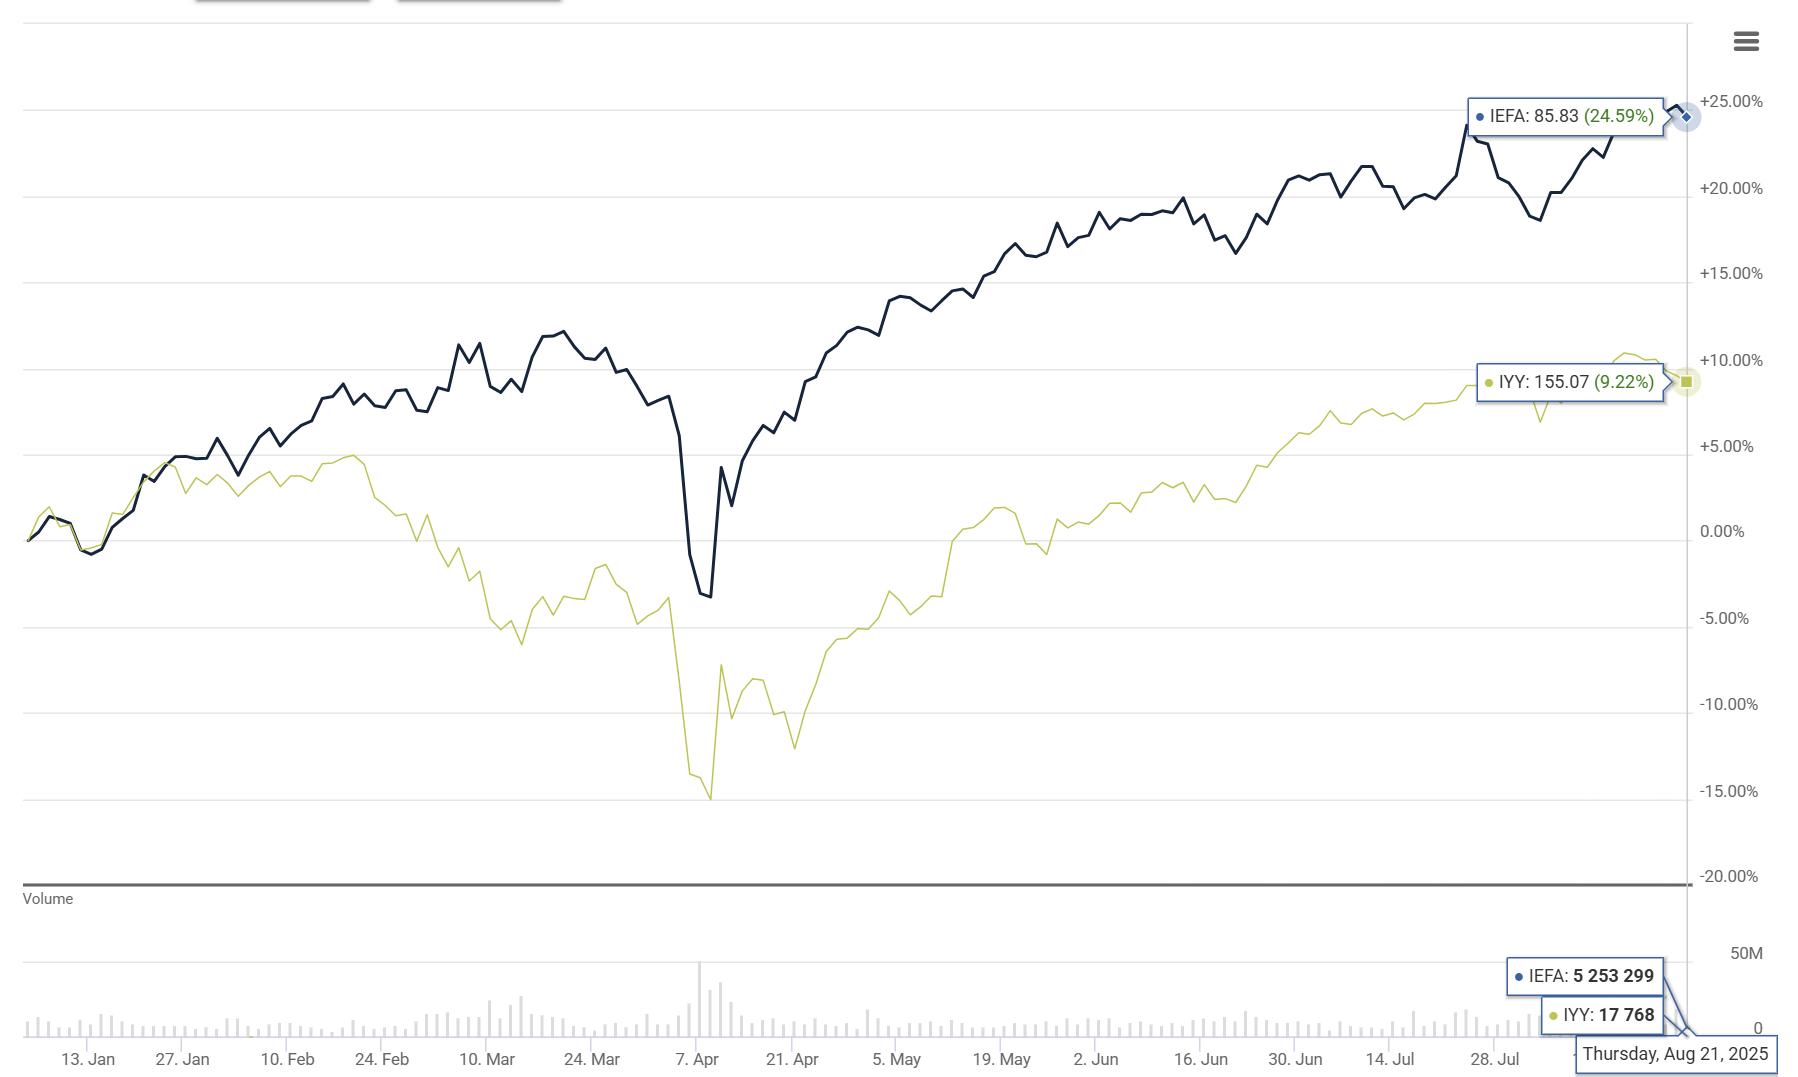
Source: AAII and QuoteMedia. Data as of 8/21/2025.
Dollars Are Flowing Into Large Blend and Money Market Funds
Large blend funds saw the largest inflows on a dollar basis during the first six months of 2025, followed by money market funds, according to Vanguard’s latest Risk Speedometers report.
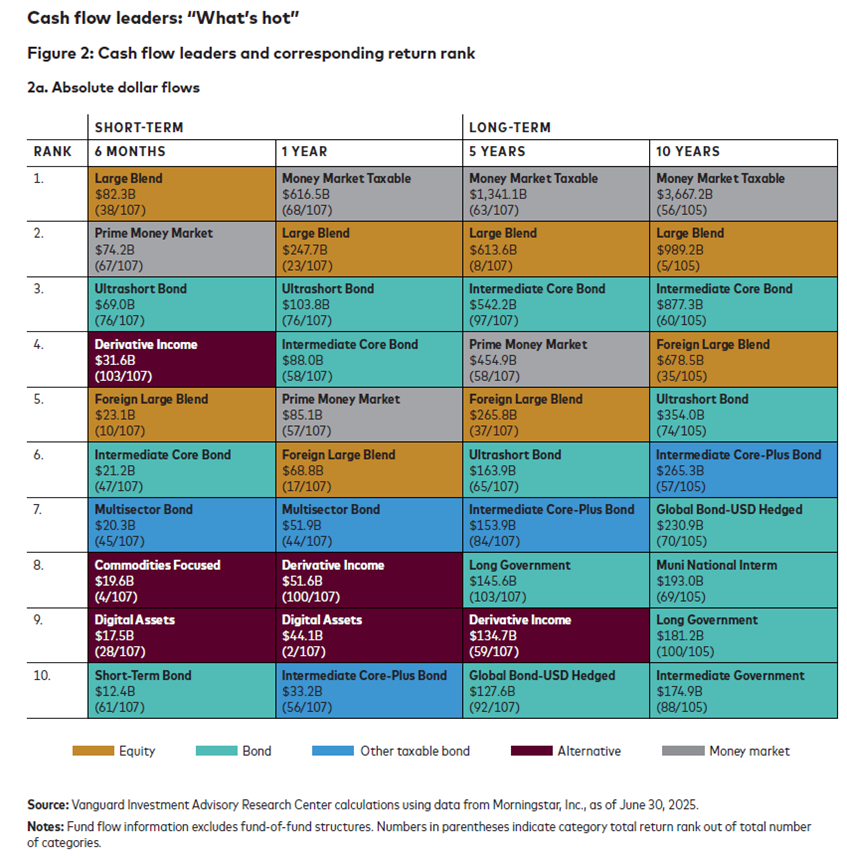
“The ranking on the left-hand side indicates where money is flowing—ordered from most to least … For example, in the Absolute dollar flows chart, the top left square tells you that Morningstar’s Large Blend category ranked first in absolute inflow over the last 6-month period with $82.3B of inflows, while its returns placed it 38th out of 107 fund categories,” explained Vanguard.
Institutional Investors Are Skittish About the Short Term
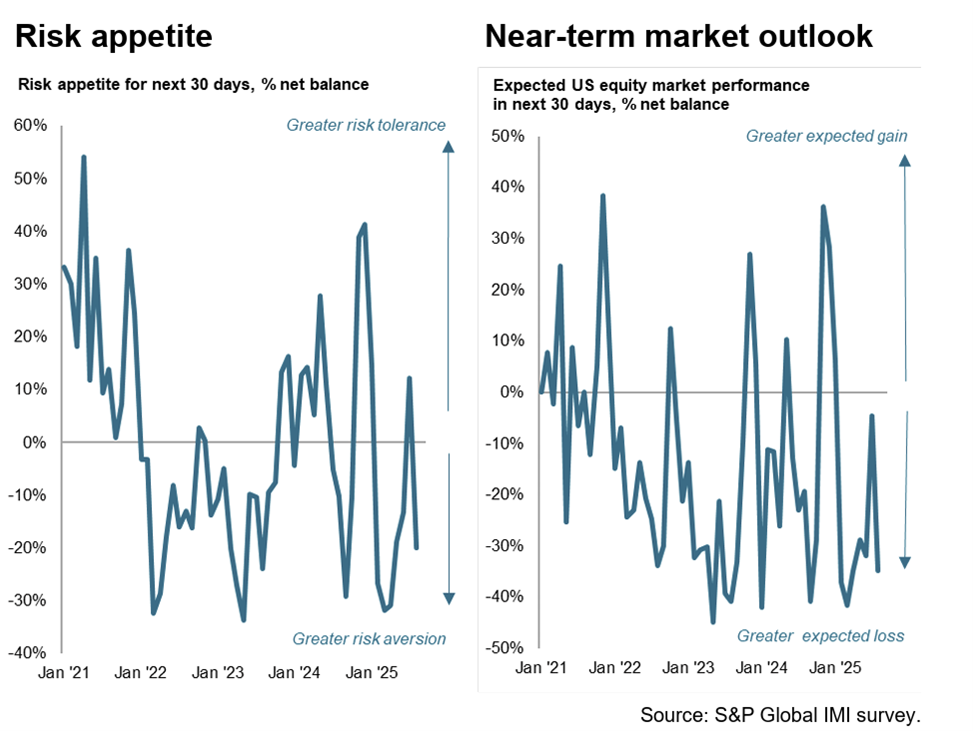
“While valuations remain the biggest concern, jitters have notably risen regarding both the [macroeconomic] and political environments,” commented S&P Global Market Intelligence in a press release about its latest Global Investment Manager Index (IMI). The IMI’s Risk Appetite index fell from +12% in July to –20% in August. The latest reading is its lowest since April.
The Majority of ETFs Are Now Actively Managed
Given Vanguard’s recent regulatory filings to launch its first actively managed stock exchange-traded funds (ETFs), I want to point out that index (passively managed) ETFs are now in the minority. At the end of July, there were 2,294 actively managed ETFs versus 2,063 passive ETFs.
J.P. Morgan Asset Management credits the ETF Rule of 2019 for the change. The rule streamlined the Investment Company Act of 1940, allowing for faster ETF launches and nontransparent active ETFs. Nontransparent ETFs do not have to disclose their full portfolio holdings on a daily basis.
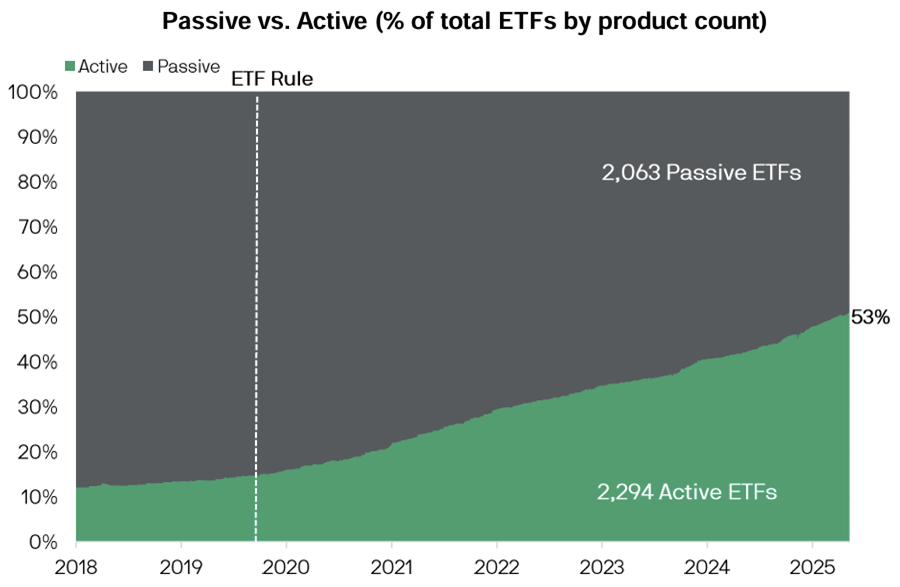
Source: J.P. Morgan Guide to ETFs. Data as of July 31, 2025.
Home Ownership Costs Have Doubled Since 2020
One of the stickier parts of inflation is shelter costs. The Atlanta Federal Reserve’s Home Ownership Affordability Monitor (HOAM) provides a monthly measure of the median-income household’s capacity to afford the median-priced home. The July 2025 reading put the monthly cost of home ownership at $3,162. This is approximately double the $1,574 per month cost from five years ago. Every aspect of home ownership has increased in price, including property insurance.
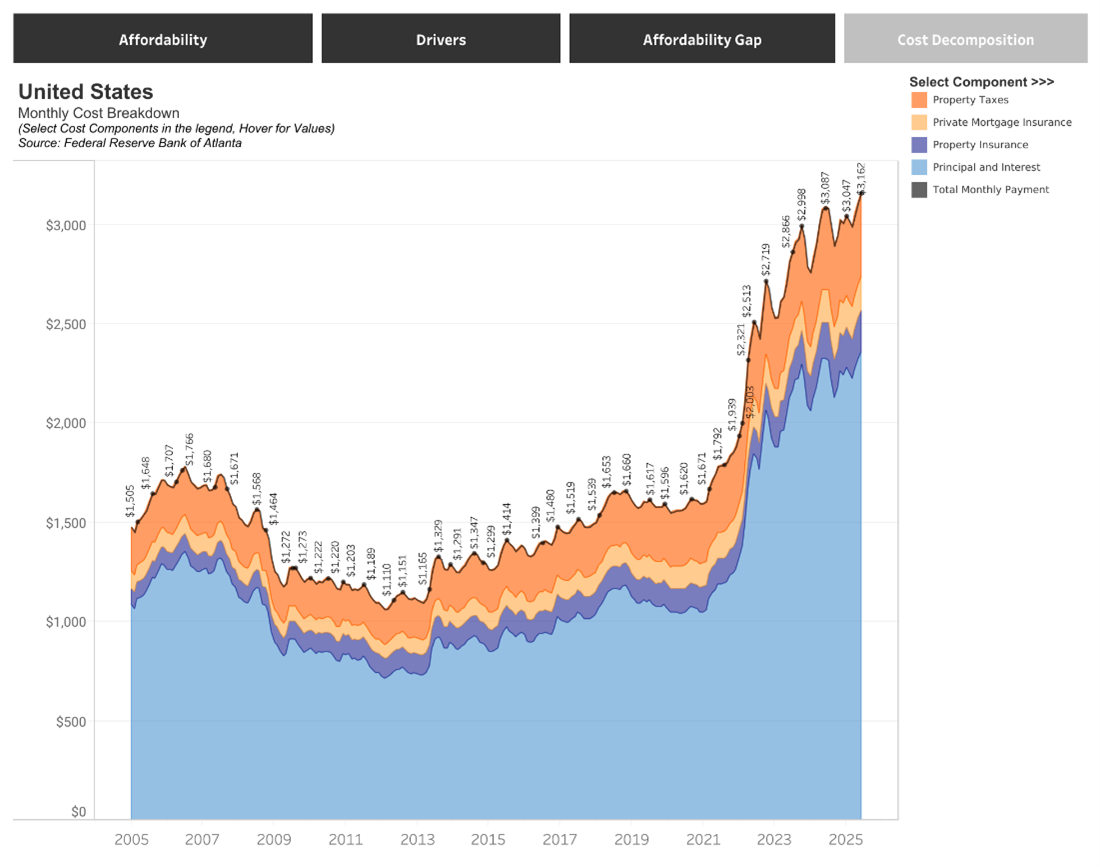

-
Active Strategies That Have Fared Well Among Mutual Funds and ETFs
When evaluating active strategies, consider manager tenure, differentiated strategies and segments with less competition for active managers. -
The Four Asset Classes With Great Long-Term Performance
If you apply the lessons of the past 90 years, it’s reasonable to expect favorable returns from following simple strategies that combine a few key asset classes. -
Is 4.7% the New Safe Retirement Withdrawal Rate?
Bill Bengen’s latest research shows that adding asset classes allows for a higher withdrawal rate in retirement than 4%. Read our recent interview with him in the August 2025 AAII Journal.
AAII Sentiment Survey
Pessimism among individual investors about the short-term outlook for stocks decreased in the latest AAII Sentiment Survey. Meanwhile, optimism and neutral sentiment increased.
Bullish sentiment, expectations that stock prices will rise over the next six months, increased 1.0 percentage points to 30.8%. Bullish sentiment is below its historical average of 37.5% for the fourth time in eight weeks.
Neutral sentiment, expectations that stock prices will stay essentially unchanged over the next six months, increased 0.4 percentage points to 24.4%. Neutral sentiment is below its historical average of 31.5% for the 57th time in 59 weeks.
Bearish sentiment, expectations that stock prices will fall over the next six months, decreased 1.3 percentage points to 44.8%. Bearish sentiment is unusually high and is above its historical average of 31.0% for the 38th time in 40 weeks.
The bull-bear spread (bullish minus bearish sentiment) increased 2.3 percentage points to –14.0%. The bull-bear spread is unusually low and is below its historical average of 6.5% for the 27th time in 29 weeks.
This week’s special question asked AAII members how they would describe the updated earnings guidance given by companies during the second-quarter 2025 earnings season.
Here is how they responded:
- Better than I expected: 34.8%
- Approximately what I expected: 40.3%
- Worse than I expected: 4.4%
- Not sure/no opinion: 20.6%
Bullish: 30.8%, up 1.0 points
Neutral: 24.4%, up 0.4 points
Bearish: 44.8%, down 1.3 points
Bullish: 37.5%
Neutral: 31.5%
Bearish: 31.0%
See more Sentiment Survey results.

August 14, 2025 Why Private Investments Don't Belong in 401(k) Accounts
August 7, 2025 Four Metrics for Identifying Risky Dividend Stocks
July 31, 2025 The Key OBBB Act Tax Changes for Individual Investors
July 24, 2025 July Charts of Interest: Tech Stocks Are Pricey vs. Other Large Caps

Discussion
MG from Puzzlement posted about 1 year ago:
Good evening, I'm puzzled by this seemingly contradictory statement in this article: '...both the S&P 500’s price-to-book-value (P/B) and price-earnings (P/E) ratios are hovering around levels not seen since the dot-com bubble. One big difference between now and the late 1990s is that technology and technology-adjacent companies are profitable—though many currently have frothy valuations.' There is zero correlation to be made, imho, between, say, NVDA today & the multiple companies such as Kozmo.com & Pets.com that imploded during the dot-com mess during the late-90's / early aughts. NVDA produces products that are in massive demand, products that are already installed with acres of data centers being built to take on even more NVDA product. The demand for AI is proven & that demand isn't slacking nor will it slack. NVDA makes the hugely profitable items that sustain this process. The writer notes the 'big difference' between now & 25 yrs ago, yet in the next breath states that the company valuations are 'frothy.' That doesn't make sense because there's no correlation. Secondly, this article is, with respect, a regurgitation of data & blithe talking points that have no bearing on a trader's outlook nor even a long-haul investor outlook. So, again with respect, I find these types of articles to be of zero value to an investor, or trader, and I look for better quality information that has some value / use to it. I just signed up for the AAII offerings. I hope they improve. all the best,
Barry from TX posted about 1 year ago:
Charles, are you channeling Joe Btfsplk? #1 Your “Top 5 worries” have been with us for a while. #2 Look at the AAII Sentiment data in this COI. Almost 70% of AAII investors have been stuck in “Neutral” or “Bearish” for almost a full year. Nothing is changing. So, what’s the “news” in all this bad news? In 1959 – about when today’s retirees were born -- the Kingston Trio sang “The Merry Minuet,” and nothing has changed since then. Compare your list to these thoughts: “They're rioting in Africa. They're starving in Spain. There's hurricanes in Florida. And Texas needs rain. // The whole world is festering. With unhappy souls. The French hate the Germans. The Germans hate the Poles. Italians hate Yugoslavs. South Africans hate the Dutch. And I don't like anybody very much. // But we shall be thankful and tranquil and proud. For man's been endowed with a mushroom-shaped cloud. And we know for certain that some lovely day. Someone will set the spark off. And we will all be blown away.” #3 If we substitute today’s problems for the ones from 66 years ago, the meter gets bumpy, but the message is unchanged. My “Greatest Generation” era mother would have said, “Get over your whiny self. My generation lived through the Depression, defeated Hitler, rode out the H-Bomb, and all we had was a radio. Now go outside and play nice. I’ll call you for supper”
Barry from TX posted about 1 year ago:
As Pogo said, "We have met the enemy and it is us." [Is this Al Capp Day?] I offer his self-portrait of AAIIers from the The Latest AAII Investor Sentiment Survey Analysis from 8/21/2025 that characterizes the “flow” of investor sentiment as: [Source: AAII] “AII Investor Sentiment enters its 7th week in Neutral territory at the 37th percentile, yet the Sentiment Compression Index—the range between the highest and lowest sentiment readings—reveals a noteworthy 20.4% spread that signals balanced uncertainty rather than polarized conviction. This compression level sits at the 57th percentile historically, indicating moderate dispersion without the extreme clustering that typically precedes volatile sentiment swings. The data reveals an intriguing behavioral pattern: neutral sentiment at 24.4% ranks in just the 23rd percentile historically, suggesting individual investors are displaying higher conviction despite the balanced headline numbers. This mirrors only a handful of instances where sentiment appeared balanced yet reflected underlying decisiveness rather than genuine indecision. Historical performance analysis shows similar Neutral periods averaging +3.4% returns during the sentiment stretch itself, with a remarkable 100% win rate across 20 comparable instances. However, forward returns become more nuanced—4-week prospects show mixed results with only 50% positive outcomes averaging +0.5%, while 13-week returns improve dramatically to +2.7% with 78% win rates. Individual investors should recognize this setup's asymmetric character: near-term volatility risk exists (worst 4-week outcome was -3.1%), but medium-term prospects favor patience, with 13-week returns ranging from -4.1% to +11.9%. The current configuration suggests neither euphoria nor despair—a historically constructive foundation for patient capital deployment.” LIke Mom said above, “Get over your whiny self. My generation lived through the Depression, defeated Hitler, rode out the H-Bomb, and all we had was a radio. Now go outside and play nice. I’ll call you for supper.”
Rob from NC posted about 1 year ago:
The S&P500 chart presents worthwhile information. It's always good to see your current position in a historical context. It might not be the optimal time to buy that S&P500 index ETF. Nevertheless, my response to this is the same as always. I'm going to sit on my hands and do nothing.
Barry from TX posted about 1 year ago:
The lower chart in COI #1 (labeled as Chart 7) pretty much tracks SPX performance over the same period as the AAII Investor Sentiment surveys since 1987. #1 The point here seems to be to compare SPX PEAKS (Apr '99, Aug '23, and 'Aug 25), TROUGHS (Oct '90, Oct '08, and Aug '11), and MARKET CYCLES over the periods that connect these points to "see" some connection between "then" and "now" and maybe the "future." #2 The chart would be more instructive/intuitive if it overlaid the recurring ECONOMIC CYCLES through its 4 phases -- expansion/recovery, peak (high), contraction/recession, and trough (low). #3 This would have been a good way to demonstrate how the 12 indicators in the new AAII INVESTOR Sentiment (4 indicators) and MARKET Sentiment (8 indicators-- breadth (3), volatility (1), trends (1), and volume (2) provide information connecting (A) investor sentiment data to (B) market performance data to (C) investor outcomes, which is THE goal of every investor. #4 If the goal in comparing the two charts was to highlight any “similarities” in the timing of the "peaks" and "troughs" recorded in the charts, then overlaying the approximate phases of the economic cycles that the graph captures would have been a good start at explaining how (A) investor sentiment formed through observartions and events that “relate” to (B) SPX market sentiment performance data (the events marked in the chart) and (C) investing outcomes. #5 Columbus crossed the Atlantic twice and regaled the Known World about the treasures ("outcomes)" in the Unknown World, but ALSO recorded and reported how the seasonality (cycles) of the winds (air speed), waves (surface speed), currents (momentum), and temperatures (pressure) propelled him to and from his “discovery.” Finding "treasure" and explaining how to get there it is one thing; explaining how to survive in the a strange "new world" is another. #6 Note for history buffs: In 1492, the Spanish throne was distracted by their victory of completing "La Reconquista," Christianity's 700-year "holy war" against Islam, when the Muslim Kingdom of Granada surrendered.
You need to log in as a registered AAII user before commenting.
Create an account