

Four Metrics for Identifying Risky Dividend Stocks
by Charles Rotblut | August 07, 2025
High dividend yields offer the promise of greater income. While there is a benefit to getting juicier dividends, high yields can be a warning sign.
Investors collectively demand higher yields when they perceive higher levels of risk. The high yield is viewed as compensation for the chance that the current stream of dividend income will not continue in the future. Higher yields are also compensation for the risk of the company encountering financial difficulties, thereby leading to a falling stock price.
This creates a paradox for dividend-focused investors: The highest yields might not represent the best opportunities, but rather the riskiest ones.
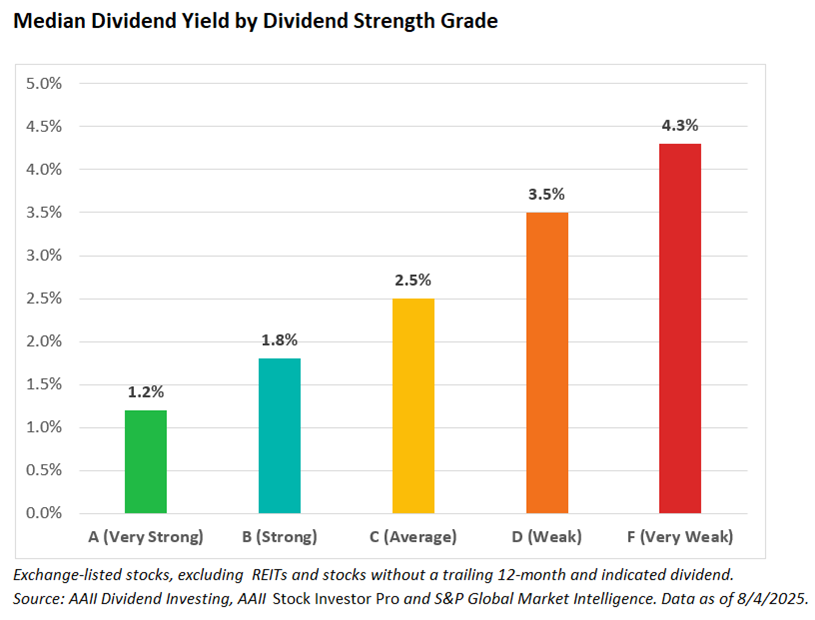
We can see this relationship between yield and risk in AAII’s Dividend Strength Grade. As dividend strength weakens, yields go up. (Dividend strength is one of three pillars used in AAII Dividend Investing to help assess whether a stock is attractive or not from a dividend standpoint. The other two pillars are dividend valuation and dividend growth. All dividend-paying stocks are assigned grades based on each of these three pillars.)
This week’s chart is one I prepared for a webinar that AAII will be co-hosting with BetterInvesting on August 26. As you can see, the median yield progressively rises as the Dividend Strength Grade worsens. Companies with a grade of A (very strong) have a median yield of just 1.2%. Companies with a grade of F (very weak) have a median yield of 4.3%.
The Dividend Strength Grade considers four key metrics to determine whether the dividend is secure and whether the company has the financial ability to grow it.
- Earnings payout ratio compared to its sector median: The lower the payout ratio, the more secure the dividend moving forward. As the payout ratio rises, the company runs the risk of having to cut its dividend if it has a cash shortfall.
- The ratio of total liabilities to total assets for latest fiscal quarter: This is also known as the debt-to-assets ratio. The higher the percentage, the greater the potential for the company to violate its debt covenants and be forced to suspend its dividend.
- Times interest earned: This metric determines how easily a (nonfinancial) company can pay its interest expenses on outstanding debt with operating earnings. The larger and more stable the ratio, the lower the risk of the company defaulting on its debt and the more able a company is to pay dividends. (Times interest earned is often referred to as the interest coverage ratio.)
- Dividend sustainability: This metric looks back over a seven-year history to see how many times a company has cut its dividend. A company should not have made any cuts to its dividend over the past seven years.
We consider sector medians for the earnings payout ratio and the times interest earned ratio because both can vary considerably. Utilities companies, for instance, pay out more of their earnings as dividends than financials companies do.
Both the payout ratio and liabilities-to-assets ratio can be found in the Ratios tab of AAII’s Stock Evaluator. (To access the Stock Evaluator, just type a stock’s ticker symbol or company name into the search box at the top-left corner of most pages on AAII.com.) The times interest earned ratio can be calculated easily using the data in the company’s financial statements. You can also look at the Financials tab of the Stock Evaluator to see whether the dividend was cut over the past seven years.
Conducting this simple analysis will give you insights into whether the dividend is secure or at risk of being cut. If the latter, then the high yield is a warning to stay away.

-
Three Pillars for Successful Dividend Investing
A look at a total-return strategy that seeks stocks that have the potential to rise in price and make larger dividend payments in the future. -
Diversifying Your Dividends for Yield and Growth
Dividend investors can enhance yield, support growth and reduce risk by diversifying across sectors. -
How a Fidelity Fund Manager Blends Growth With Income
Learn why Matt Fruhan believes earnings growth, yield and valuation are the critical components of stock performance in the August 2025 AAII Journal.
AAII Sentiment Survey
Pessimism among individual investors about the short-term outlook for stocks increased in the latest AAII Sentiment Survey. Meanwhile, optimism and neutral sentiment decreased.
Bullish sentiment, expectations that stock prices will rise over the next six months, decreased 5.5 percentage points to 34.9%. Bullish sentiment is below its historical average of 37.5% for the second time in six weeks.
Neutral sentiment, expectations that stock prices will stay essentially unchanged over the next six months, decreased 4.8 percentage points to 21.9%. Neutral sentiment is below its historical average of 31.5% for the 55th time in 57 weeks.
Bearish sentiment, expectations that stock prices will fall over the next six months, increased 10.2 percentage points to 43.2%. Bearish sentiment is unusually high and is above its historical average of 31.0% for the 36th time in 38 weeks.
The bull-bear spread (bullish minus bearish sentiment) decreased 15.7 percentage points to –8.4%. The bull-bear spread is below its historical average of 6.5% for the 25th time in 27 weeks.
This week’s special question asked AAII members what they think about the Federal Reserve’s decision to keep interest rates unchanged.
Here is how they responded:
- They should have raised rates: 1.0%
- It was the right move: 66.5%
- They should have cut rates: 29.6%
- Not sure/no opinion: 2.6%
Bullish: 34.9%, down 5.5 points
Neutral: 21.9%, down 4.8 points
Bearish: 43.2%, up 10.2 points
Bullish: 37.5%
Neutral: 31.5%
Bearish: 31.0%
See more Sentiment Survey results.

AAII Asset Allocation Survey
Individual investors’ allocations to stocks increased while bond and cash allocations decreased in the July AAII Asset Allocation Survey.
Stock and stock fund allocations increased 0.8 percentage points to 68.3%. Stock and stock fund allocations are above their historical average of 61.5% for the 62nd consecutive month.
Bond and bond fund allocations decreased 0.2 percentage points to 15.7%. Bond and bond fund allocations are below their historical average of 16.0% for the 16th time in 18 months.
Cash allocations decreased 0.6 percentage points to 16.0%. Cash allocations are below their historical average of 22.5% for the 32nd consecutive month.
- Stocks and Stock Funds: 68.3%, up 0.8 percentage points
- Bonds and Bond Funds: 15.7%, down 0.2 percentage points
- Cash: 16.0%, down 0.6 percentage points
- Stocks: 31.2%, down 1.0 percentage points
- Stocks Funds: 37.1%, up 1.8 percentage points
- Bonds: 5.1%, down 0.0 percentage points
- Bond Funds: 10.6%, down 0.2 percentage points
- Stocks/Stock Funds: 62.0%
- Bonds/Bond Funds: 16.0%
- Cash: 22.0%
Take the Asset Allocation Survey.
July 31, 2025 The Key OBBB Act Tax Changes for Individual Investors
July 24, 2025 July Charts of Interest: Tech Stocks Are Pricey vs. Other Large Caps
July 17, 2025 Why Some Swings in Market Sentiment Matter More Than Others
July 10, 2025 Combining Indicators to Better Assess the Market's Mood

Discussion
Barry from Texas posted about 1 year ago:
Charles, #1 A "fun" project might be to apply these 4 ratios to the federal government's ability to sustain its "dividends" and benefits (shareholder returns). I am sure someone has already done this somewhere. #2 These "3rd derivative" ratios are fine as a "point estimate", but the better estimates of the ability of a company to sustain its dividend payouts come from data further down, closer to the "top line" income flows (sales, revenues, cash flow) where the "leading indicators" reside. I am pretty sure there are AAII articles on how to use these "1st derivative" data as "early warning signals." I am just too lazy to look them up. #3 These are two more examples of the wider application of how standard "AAII analytics" could be used as a systems analysis to understand how any "capitalist" system relies on tracking the sources of income and uses to grow the business. A key SA principle is that the causes of a problem observed in one part of an organization (sustaining dividends) are usually found in other locations "upstream" (top line data flows).
You need to log in as a registered AAII user before commenting.
Create an account