

Beware of the Popularity Trap for ETFs
by Charles Rotblut | September 04, 2025
Exchange-traded funds (ETFs) have been a hotbed for launching thematic ideas. The combination of shifting investor preferences and ETFs being easier to launch than mutual funds has made them the go-to vehicle for new fund ideas.
Even when an ETF or mutual fund is not new, it can see a big jump in investor interest if it is focused on the right theme at the right time. Performance soars, investors buy shares because of the performance and everything is good … until it’s not.
Either the investment theme gets overly crowded because too much money went into the same securities, valuations of the targeted securities rise to an unsustainable level or there is a combination of both. Investors who fail to exit those funds before the party ends endure disappointing returns.
This pattern has been repeated throughout history. The most famous example was Long-Term Capital Management (LTCM). The hedge fund collapsed in 1998 because it and its competitors put more dollars into esoteric trading strategies than those strategies had the capacity to handle.
While LTCM was an outlier in terms of its size and financial impact, there have been many thematic ETFs and mutual funds that have also become too popular for their investment themes.
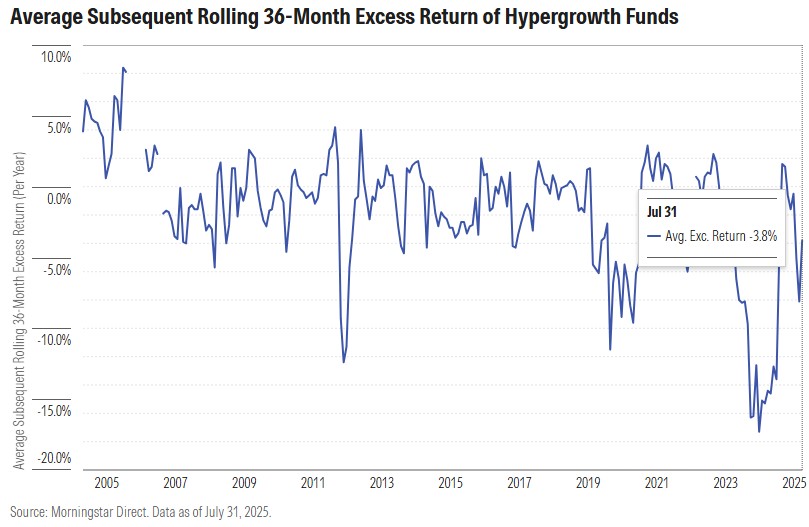 Morningstar’s Jeffrey Ptak, CFA, looked at hyper-inflow funds. These are ETFs and mutual funds with 12-month increases in net inflows of at least 200% relative to net assets. (Net inflows are dollars invested into a fund less dollars withdrawn.) He limited the universe to funds with a minimum starting net asset value (NAV) of at least $500 million. As such, all 568 of the identified funds had at least $1 billion in net inflows. The study period was August 1, 1998, through July 31, 2025.
Two-thirds of these hyper-inflow ETFs and mutual funds outperformed their broad benchmark by a wide margin when times were good. “All told, the average rolling 36-month excess return was around 3.6% per year, meaning these funds typically had their growth spurt when they were handily outperforming,” wrote Ptak.
It was a different story over the next 36-month periods. Those winning funds lagged the broader market 60% of the time. While that may not sound too bad, the results were positively skewed by the strong performance of value funds during the first half of the 2000s. Since 2005, “reversals have been more frequent and painful.” Average excess returns have turned into average negative returns. Underperformance relative to the funds’ benchmarks has worsened.
Many ETF providers will list valuation characteristics for stock funds in the ETF’s fact sheet or on their website. High valuations for an ETF’s portfolio are often a sign that there is performance-chasing occurring—potentially too much.
(The AAII ETF Guide links to most fund family websites. Select a category to bring up the tables, then click on the Management and Fees tab and scroll to the rightmost column.)
If the fund invests in other types of assets, then it can be harder to form an opinion about valuation. Tread carefully if the fund uses a more complex strategy than simply buying the underlying asset (e.g., stocks, bonds, etc.).

-
An Improved Way to Find Mutual Funds and ETFs
AAII’s mutual fund and ETF guides and screeners got an enhanced and more user-friendly interface. Plus, screeners have more flexibility when choosing filters and saving screens. -
Guidelines for Selecting Mutual Funds and ETFs
PRISM leads you to consider funds appropriate for you and what you are trying to achieve. -
Do Low Volatility Funds Offer Smoother Rides Through Rough Markets?
The new September 2025 AAII Journal gives the lowdown on low volatility funds, which aim to reduce risk and deliver stronger results during market downturns or periods of slowing economic growth.
AAII Sentiment Survey
Pessimism among individual investors about the short-term outlook for stocks increased in the latest AAII Sentiment Survey. Meanwhile, optimism and neutral sentiment decreased.
Bullish sentiment, expectations that stock prices will rise over the next six months, decreased 1.9 percentage points to 32.7%. Bullish sentiment is below its historical average of 37.5% for the sixth time in 10 weeks.
Neutral sentiment, expectations that stock prices will stay essentially unchanged over the next six months, decreased 2.0 percentage points to 23.9%. Neutral sentiment is below its historical average of 31.5% for the 59th time in 61 weeks.
Bearish sentiment, expectations that stock prices will fall over the next six months, increased 3.9 percentage points to 43.4%. Bearish sentiment is unusually high and is above its historical average of 31.0% for the 40th time in 42 weeks.
The bull-bear spread (bullish minus bearish sentiment) decreased 5.8 percentage points to –10.7%. The bull-bear spread is below its historical average of 6.5% for the 29th time in 31 weeks.
This week’s special question asked AAII members how they would describe the current state of the economy.
Here is how they responded:
- Great: 4.0%
- Good: 34.9%
- Mixed: 54.7%
- Lousy: 5.7%
- Not sure/no opinion: 0.7%
Bullish: 32.7%, down 1.9 points
Neutral: 23.9%, down 2.0 points
Bearish: 43.4%, up 3.9 points
Bullish: 37.5%
Neutral: 31.5%
Bearish: 31.0%
See more Sentiment Survey results.

AAII Asset Allocation Survey
Individual investors’ allocations to stocks decreased while bond and cash allocations increased in the August AAII Asset Allocation Survey.
Stock and stock fund allocations decreased 1.0 percentage points to 67.3%. Stock and stock fund allocations are above their historical average of 61.5% for the 63rd consecutive month.
Bond and bond fund allocations increased 0.5 percentage points to 16.2%. Bond and bond fund allocations are above their historical average of 16.0% for the first time in three months.
Cash allocations increased 0.5 percentage points to 16.5%. Cash allocations are below their historical average of 22.5% for the 33rd consecutive month.
- Stocks and Stock Funds: 67.3%, down 1.0 percentage points
- Bonds and Bond Funds: 16.2%, up 0.6 percentage points
- Cash: 16.5%, up 0.4 percentage points
- Stocks: 29.0%, down 2.2 percentage points
- Stocks Funds: 38.3%, up 1.2 percentage points
- Bonds: 5.6%, up 0.5 percentage points
- Bond Funds: 10.6%, up 0.0 percentage points
- Stocks/Stock Funds: 62.0%
- Bonds/Bond Funds: 16.0%
- Cash: 22.0%
Take the Asset Allocation Survey.
August 28, 2025 History Cautions That Keurig Dr Pepper Spin-Off Returns Could Fizzle
August 21, 2025 August Charts of Interest: Valuations at Dot-Com Bubble Levels
August 14, 2025 Why Private Investments Don't Belong in 401(k) Accounts
August 7, 2025 Four Metrics for Identifying Risky Dividend Stocks

Discussion
Barry from TX posted about 1 year ago:
Charles, Interesting, but is this “news”? #1 I thought all the “thematic investors” had caught the “Last Train to Clarksville.” #2 Really? Some thematic funds are created to lure investors who “care more” than we cynical “profit-motivated” investors who invest just to increase our personal wealth. #3 Really? Do they invest in companies with “thematic” strategies that have no obvious connection to improving profitability? #4 Really? “I am shocked. “Alert the police!” This has happened many times before. #5 Really? “Welcome to Hollywood, baby, what’s your dream?” More serious comment. #6 It is very important to distinguish “thematic” investing and “factor” investing in ALL forms across history. Tulips were a “thematic“ investing theme in 1637. In the 1990s, LTCM was a ”thematic” fund. LTCM bought correlated bond spreads and bet the two prices would come back towards each other. #7 I am unaware of any STUDIES or any EVIDENCE that has proved there is a positive relationship between the “value” “thematic” funds create for anyone except fund sellers AND company profitability while there a few hundreds of studies that have proven that factor anomalies – like size/small-cap, value/low cost, growth/price momentum, quality/financial fundamentals – do during certain market cycles. #8 “during certain market cycles” is a very important warning. #8 Some factor funds work some of the time. Most thematic funds don’t work most of the time. That’s the message.
You need to log in as a registered AAII user before commenting.
Create an account