

Guidelines for Selling Stocks
by Charles Rotblut | September 07, 2023
Featured Tickers: NVDA
NVDA
The idea of writing about sell rules comes from an ongoing discussion that I’m involved in. My investment club has owned shares of Nvidia Corp.  (NVDA) for several years. Given its significant increase in price, some of us—including me—are in the “let’s lock in some of our profits” camp. Others are focused on the strong ongoing growth prospects for the company given the rise of artificial intelligence (AI) and want to hold on to the stock.
The semiconductor company’s numbers speak for themselves. For the second quarter ending in July, revenue doubled year over year to $13.5 billion and adjusted earnings surged 429% from one year ago to $2.79 per share. Cash from operating activities jumped to $9.3 billion for the first half of 2023 from $3.0 billion in the first half of 2022. Enthusiasm about the company’s numbers and prospects have led to a lofty price-earnings (P/E) ratio of 113.7 and a very high price-to-sales (P/S) ratio of 35.61.
 How you view a high-growth stock—be it Nvidia or another stock—depends on your style of investing. Those in the value camp, like me, are willing to sell when valuations get pricey. Those in the growth camp focus not only on past growth but also on the prospects for continued strong growth. In the middle are those who seek growth but set an upper limit on how much they are willing to pay in terms of valuations. This is known as growth at a reasonable price, or GARP.
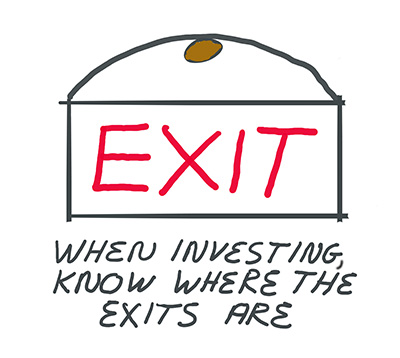
Regardless of the type of investor you consider yourself to be, it is important to know what will cause you to sell before buying an investment. I call this knowing where the exit doors are. Clear, established sell rules provide the needed guidance to determine whether you should hold or sell. Without such rules in place, you (and me) will be left to emotions and cognitive biases. This is never a good thing. The best time to determine when to sell is before the decision needs to be made. Ideally, you should set the sell parameters before you submit an order to buy a stock or any other type of investment.
All five AAII model portfolios—Model Shadow Stock Portfolio, Dividend Investing, Growth Investing, Stock Superstars Report and VMQ Stocks—have predefined, written deletion rules. These rules have allowed the portfolios to stay disciplined with their addition and deletion decisions.
If you haven’t set any up before, don’t fret. Short, simple rules can work very well. For instance, our Model Shadow Stock Portfolio has just three key deletion rules. A stock is deleted if its market capitalization gets too large, its price-to-book-value (P/B) ratio rises too much or if the company ceases to be profitable on a trailing 12-month basis.
Your rules may differ based on your strategy and preferences. Here are brief guidelines for four major investing styles that you can use as a basis for creating your own portfolio rules.
- Growth: High rates of growth cannot be sustained for long periods; excessive valuations such as a forward-looking price-earnings ratio above 40 or 50 can signal that expectations are too high. (It is rare for a company to maintain both a very high rate of growth and a high valuation over a period of several years; the few that have are the exception, not the rule.) Downward revisions to earnings estimates, negative earnings surprises on consecutive quarters and a trend of slowing inventory turnover (cost of goods sold divided by average inventories for the past two fiscal periods) are signs of concern for a growth company.
- Value: Valuations that exceed prevailing market levels imply that the stock is no longer a value player and thus no longer matches the spirit of the strategy used to purchase it. Signs of deterioration in a company’s fiscal soundness can indicate that the stock is not mispriced, but rather deserves to trade at a low valuation.
- Momentum/Technical Analysis: Stocks purchased on the basis or expectation of upward price momentum should be sold on signs of price weakness. The relative price strength rank is a useful indicator for determining this. The A+ Investor Momentum Grade worsens to D when a stock’s relative strength rank falls to the bottom 40% of all stocks. (The grades are just like you had in school. A’s and B’s made your parents happy; D’s and F’s got you grounded.) Chartists should pay attention to support and resistance levels or trendlines, if used, to ensure the stock does not fall out of its trading range.
- Income/Yield: If the dividend is cut or suspended, run away. Yields below the bottom average range of the past five to seven years imply that the stock is overvalued. Watch the cash flow statement to ensure the company maintains enough free cash flow (operating cash flow minus capital expenditures) to cover the dividend and grow it. If a company stops raising its dividend, investigate the reasons why.

-
Strategies for Selling Stocks, Including Guidelines From Experts
Disciplined rules for selling can consider a deterioration in the company’s prospects, preset targets and stop limits. -
Being Wrong and Still Making Money
An analysis of nearly 31,000 trades found that successful professional investors all adopted the same habits of execution. -
Why It Makes Sense to Pair Momentum With Value in a Portfolio
Stocks exhibiting positive momentum and value characteristics offer superior expected returns over ones that only look good on one of the two dimensions. -
Analysts Are Raising Earnings Estimates Following Second-Quarter Beats
Second-quarter 2023 earnings season exceeded expectations by the highest margin in nearly two years. -
Why ETFs Can Trade at Premiums and Discounts to Their Net Asset Value
ETFs trade at prices either above or below their net asset value due to supply and demand imbalances that are influenced by a variety of factors.
Members are looking for your input. Can you help with this question from the Mutual Funds & ETFs Community?
“A recent AAII Journal article titled, “Technology Titans: Top Semiconductor ETFs and Their Stocks” discusses how artificial intelligence (AI) has contributed to the strong performance of the semiconductor industry this year. Do you think the hype around AI and other emerging technologies will continue to drive this industry’s growth? Why or why not?
Tap the button and then choose the Join the Community button on the right to answer this question in the AAII Community
Answer This Question in the AAII Community »
AAII Sentiment Survey
Bullish sentiment is above average for the first time in four weeks in the latest AAII Sentiment Survey. Neutral sentiment is at a seven-week low, and bearish sentiment is at a four-week low.
Bullish sentiment, expectations that stock prices will rise over the next six months, increased 9.1 percentage points to 42.2%. Optimism is above its historical average of 37.5% for the first time in four weeks.
Neutral sentiment, expectations that stock prices will stay essentially unchanged over the next six months, decreased 4.2 percentage points to 28.2%. Neutral sentiment is below its historical average of 31.5% for the first time in four weeks.
Bearish sentiment, expectations that stock prices will fall over the next six months, decreased 4.9 percentage points to 29.6%. Bearish sentiment is below its historical average of 31.0% for the first time in three weeks.
The bull-bear spread (bullish minus bearish sentiment) increased 14.0 percentage points to 12.6%. This is the first time in four weeks that the bull-bear spread is above its historical average of 6.5%.
This week’s special question asked AAII members about their perception of inflation. Here are the responses:
- Slowing, but not by enough: 48.0%
- It’s returning to a more acceptable pace: 34.8%
- It’s still rising too quickly: 16.0%
- Other/not sure: 0.9%
Bullish: 42.2%, up 9.1 points
Neutral: 28.2%, down 4.2 points
Bearish: 29.6%, down 4.9 points
Bullish: 37.5%
Neutral: 31.5%
Bearish: 31.0%
See more Sentiment Survey results.

AAII Asset Allocation Survey
Individual investors’ equity allocation reached a 15-month high last month. The August Asset Allocation Survey also shows fixed-income exposure rebounding and cash allocations falling.
Stock and stock fund allocations rose 0.1 percentage points to 67.1%. Though a very small increase, it was enough to put equity allocations at their highest level since May 2022, which was also 67.1%. Additionally, last month’s increase keeps stock and stock fund allocations above their historical average of 61.5% for the 39th consecutive month.
Bond and bond fund allocations increased 0.5 percentage points to 15.5%. August marked the 30th consecutive month with fixed-income allocations below their historical average of 16.0%.
Cash allocations decreased 0.6 percentage points to 17.4%. This is the smallest allocation to cash since April 2022 (17.6%). The drop keeps cash allocations below their historical average of 22.5% for the ninth consecutive month.
Though equity allocations rose last month, optimism in the weekly AAII Sentiment Survey fell back below average. Additionally, yields on the benchmark 10-year Treasury bond hit their highest level since 2007 in August.
- Stocks and Stock Funds: 67.1%, up 0.1 percentage points
- Bonds and Bond Funds: 15.5%, up 0.5 percentage points
- Cash: 17.4%, down 0.6 percentage points
- Stocks: 31.6%, down 0.6 percentage points
- Stocks Funds: 35.6%, up 0.7 percentage points
- Bonds: 5.2%, up 0.3 percentage points
- Bond Funds: 10.3%, up 0.1 percentage points
- Stocks/Stock Funds: 62.0%
- Bonds/Bond Funds: 16.0%
- Cash: 22.0%
Take the Asset Allocation Survey.
August 31, 2023 Interest Rates Are Higher. Your Taxes Could Be Too.
August 24, 2023 August Charts of Interest: More Costly to Finance Big Purchases
August 17, 2023 Can You Use ChatGPT to Create a Portfolio of Stocks?
August 10, 2023 Earnings Are Better Than Expected, but Look Beyond the Surprises

Discussion
Rob from NC posted over 3 years ago:
Once I've bought a stock, I generally keep it unless and until (1) the company starts circling the drain (meaning it's no longer very profitable and is not likely to become very profitable on its current trajectory) or (2) I find a SUBSTANTIALLY better investment. I agree with Warren Buffett that the optimal hold time for a stock is "forever." "Locking in profits" also means you won't be making any more on the good company you sold. I bought some NVDA last year, and it will probably still be in my portfolio when I assume room temperature. I hope it will be, anyway. The way I look at it, I could sell now and realize a 175% long-term gain, but then I'd have to pay taxes and find something substantially better for what's left over (better to the degree that it will at least make up for the taxes coming out of my portfolio). Do I think 10 years from now that I'll be glad I stayed with NVDA? Or is there something else out there that I'm fairly certain will perform substantially better than NVDA in the next 10 years? Those are the sorts of questions I try to answer.
Barry from TX posted over 3 years ago:
I counted 8 articles in the AAII archives on this topic - 4 this month. Is this a hint?
Barry from TX posted over 3 years ago:
The group persona of the AAII Members who vote on the Sentiment Survey continues to hint at a possibility of suppressed schizophrenic tendencies. Last week’s survey results data show that overall bullishness shifted UP 12% (37.5% to 42.2%) from neutral (down 10%) and bearish (down 5%). Yet, the Asset Allocations survey shows that AAII member asset (actual) allocations REDUCED stock allocations (down 0.6%) and INCREASED bonds allocations 10.6%. DSM5 says schizophrenic symptoms include paranoid thoughts, disorganized thinking, false beliefs, seeing things that don't exist, and/or hearing voices. The only “voice” AAII members share in common is Charles’ update articles. Is there a Svengali effect or a split-brain effect at work here? Or could it be that survey respondents view sentiment (their feelings) as a separate mental state from behavior (their actions)? See prior comment. Or maybe it could be that very few members read these articles or use selling rules. We definitely need to be frequently reminded of the need for rules to direct selling decisions. Evidence: We only have two comments. One serious and this one.
John L from NJ posted over 3 years ago:
Nobody knows anything! Since before 1929, the finance literature has documented the poor performance of newsletters and most stock pickers. Yet despite this grim truth, the average investor believes they can beat the market. And so the AAII has articles on stock screens and sell rules. Instead of a sentiment survey, AAII ought to have a survey of how many members have actually beat an S&P 500 index fund over the last 5 years. Answering honestly would be painful for almost everyone. But if you can't beat it; join it and save the hassle and expense!
Hugh from WA posted over 3 years ago:
John L, I'll volunteer that I've beat the S&P 500 over that past five years. On the other hand, S&P 500 beats me for longer time periods. My main observation is that my portfolio has lower variance and it retained value better when the S&P 500 dropped dramatically in the recent past. I tend to agree with your basic premise but have been slow to implement, which is a segue to my main comment that a key driver for my decision to sell is whether I am more excited by a new prospect. I have a list of stocks that will be the first to go when I want the cash. A couple came back to do all right, most just piddle along and a few I probably should have sold already. Pretty much what you would expect.
Rob from NC posted over 3 years ago:
John L, I'd agree with you that buying an index fund such as IVV wouldn't be a bad lifetime strategy. Nevertheless, through luck or through craft, I've beaten the S&P500 over the past one, three, and five years--and since 1/1/2009. The five-year figures Schwab gives me are 12.33% versus 10.82%. The figures since 1/1/2009 are 18.13% versus 13.68%. (These percentages do not include dividends.) In fact, I'm pretty sure I've beaten the S&P500 over the past 40 years, although I haven't compiled all the figures on that. This is not to say that I'm some sort of investing genius; I'm not Warren Buffett. I attribute my "success" to simple buy-and-hold discipline. Churning stocks in response to a screen or using automatic sell rules might lead to better returns (certainly the charts and graphs associated with the various screens published in the AAII Journal seem to show that) but I remain skeptical. I'd like to hear more from those who have been successful over long periods with the screens or with particular sell rules. Keep in mind that the richest people in the world got that way through very-long-term holding of assets--many from ownership in a single company.
Rob from NC posted over 3 years ago:
I'll confess that I'm suffering attenuated gains from violating my own sell rules. About 10 years ago, I sold off portions of good stocks I'd held for a very long time so that I could retire "safely" with enhanced diversification. That is, I sold a big portion of my narrow portfolio of a small number of good stocks and bought index ETFs with the after-tax proceeds. The stocks I partially sold off have substantially outperformed the ETFs, leading me to cringe at the gains I gave up. I guess I shouldn't complain though, because I do believe diversification provides insurance against my own stupidity.
You need to log in as a registered AAII user before commenting.
Create an account