

Earnings Are Better Than Expected, but Look Beyond the Surprises
by Charles Rotblut | August 10, 2023
Second-quarter earnings season has so far exceeded expectations by a higher margin than we’ve recently seen. Refinitiv says 78.6% of S&P 500 index companies have topped expectations, “the highest beat rate” since the third quarter of 2021. The magnitude of positive surprises, at 7.7% above expectations, is also the largest since the third quarter of 2021.
While whether a company beats, meets or misses expectations influences how investors react to earnings, it is only one part of incorporating earnings estimates into a strategy.
 Let’s start with the basics. Earnings estimates are forecasts made by analysts about how much a company will earn over a given quarter or year. The consensus estimate is the average of all the analysts’ forecasts made for a given quarter or year. Changes in consensus earnings estimates are a driver of stock prices. Earnings estimates that are revised upward are a catalyst to drive stock prices higher, while earnings estimates that are revised downward are a catalyst to drive stock prices lower or at least underperform.
An earnings estimate that differs from reported earnings at the time of release is called a surprise. The price reaction following an earnings surprise is referred to as the post-earnings announcement drift, or simply “PEAD.” It is typically positive for a beat and negative for a miss. What’s notable about the PEAD is that it often extends for a period after the earnings announcement. Yes, there is an immediate reaction but there is also a lagged effect. This lagged effect reflects slowness on the part of investors (institutional and individual) in absorbing the new information and reassessing their outlook for the stock.
The magnitude of the surprise also plays a role. Exceeding expectations by a penny or two counts as a beat, but it is not as much of a surprise as being well above expectations. When companies issue earnings that are big (positive or negative) surprises, they tend to have a bigger reaction. This is particularly the case if the surprise was above (below) the most optimistic (pessimistic) analyst’s forecast.
Surprises and guidance are two different things. A company could top analyst expectations but then lower its own expectations (called guidance) for the remainder of the year. It’s preferable to have a company beat the consensus estimate and also raise its guidance above what analysts have been expecting. Similarly, you want to be cautious if a company both misses the consensus estimate and also lowers its guidance.
There are two AAII stock screens focused on earnings estimate revisions: the Estimated Revisions Up 5% screen and the Estimate Revisions Top 30 Up screen. They are among our best-performing screens since inception, with annualized price gains of 21.3% and 21.0%, respectively (based on monthly reconstituting of the passing companies).
Because there is a calendar-based cyclicality to earnings estimate revisions, stocks fall off the passing companies list for each of these screens simply because analysts didn’t make any significant changes to their estimates between earnings announcements. If you wish to avoid high levels of turnover, it can be worthwhile to hold onto a stock dropped from either screen if the only change is a lack of new revisions by analysts.
One thing I like about earnings estimate revisions is that they can be layered onto many other strategies. Growth investors can use them to ensure the companies they invest in are expected to continue to grow at a stronger-than-anticipated pace. Value investors can use them to identify bargain stocks with a catalyst to rise in price. Chartists can use earnings estimate revisions to determine if there is underlying support for the expected price trend.
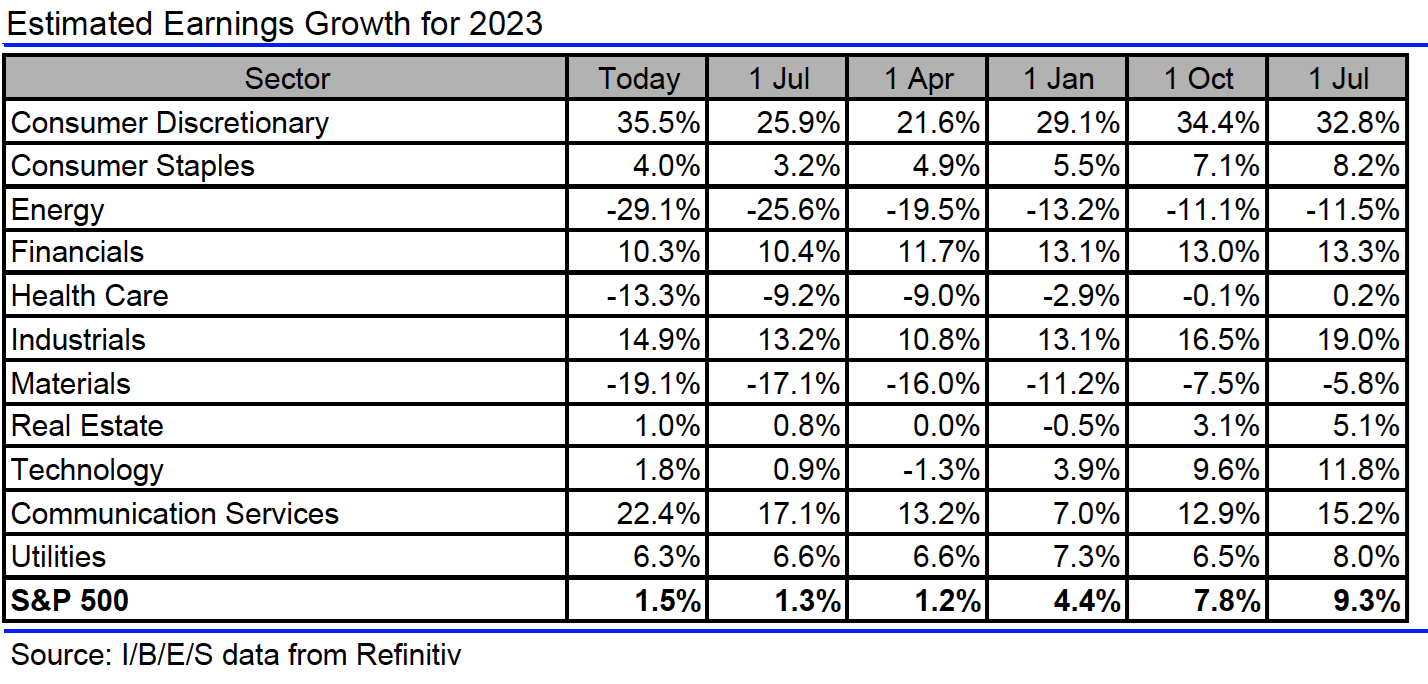
Regarding the revisions that analysts are currently making, Refinitiv’s consensus estimate now calls for S&P 500 earnings to rise 1.5% this year. This is up from 1.3% growth projected on July 1, signaling positive aggregate revisions. Analysts have also raised their 2024 forecasts to reflect 12.1% growth, up from 11.7% on July 1.

-
AAII’s Top-Performing Screens
See the list of AAII stock screens ranked by performance since inception at the Screen Power Rankings page. -
How to Analyze Earnings Surprises
Calculating the significance of an earnings surprise, and where to find earnings surprises on AAII.com. -
Leisure Stocks With Upward Estimate Revisions
This month’s Stocks First Cut screens for travel and leisure companies whose earnings estimates have been revised upward over the last month. -
Tech and Global Action Drive Second-Quarter Returns
Investors breathed a sigh of relief as equity mutual funds and exchange-traded funds (ETFs) landed in positive territory for the third consecutive quarter. -
Record-High Participation in Retirement Plans
Vanguard’s annual look at the performance of nearly five million defined-contribution plan participants shows encouraging results.
Members are looking for your input. Can you help with this question from the Allocation Strategies Community?
“In the article ‘How AAII Members Have Responded to Interest Rate Hikes,’ it was noted that the use of dividends as a source of portfolio income remains popular among AAII members despite the interest rate hikes. What drives your decision for seeking income from stocks versus bonds?”
Tap the button and then choose the Join the Community button on the right to answer this question in the AAII Community
Answer This Question in the AAII Community »
AAII Sentiment Survey
Optimism decreased but remains above average for the 10th consecutive week in the latest AAII Sentiment Survey. Both neutral sentiment and bearish sentiment increased.
Bullish sentiment, expectations that stock prices will rise over the next six months, decreased 4.3 percentage points to 44.7%. This is the 10th consecutive week that bullish sentiment is above its historical average of 37.5%. This has been the longest above-average streak since a 13-week stretch from February to May 2021. Bullish sentiment returned to its typical range this week after being unusually high last week.
Neutral sentiment, expectations that stock prices will stay essentially unchanged over the next six months, increased 0.1 percentage points to 29.8%. Neutral sentiment is below its historical average of 31.5% for the eighth time in 10 weeks.
Bearish sentiment, expectations that stock prices will fall over the next six months, increased 4.2 percentage points to 25.5%. At 10 consecutive weeks, this is the longest that pessimism has been below its historical average of 31.0% since a 23-week streak from February to July 2021. After nearing an unusually low level last week, bearish sentiment is back within its typical range.
The bull-bear spread (bullish minus bearish sentiment) decreased 8.5 percentage points to 19.2%. The bull-bear spread is in its typical range and remains above average for the 10th consecutive week.
This week’s special questions asked AAII members if they thought other investors were too bullish or bearish right now. Here are the responses:
- They are too bullish: 53.2%
- Their sentiment toward the market is about right: 20.8%
- They are too bearish: 16.4%
- No opinion/not sure: 9.6%
Bullish: 44.7%, down 4.3 points
Neutral: 29.8%, up 0.1 points
Bearish: 25.5%, up 4.2 points
Bullish: 37.5%
Neutral: 31.5%
Bearish: 31.0%
See more Sentiment Survey results.

August 3, 2023 How Much Is a Mega Millions Lottery Ticket Worth?
July 27, 2023 Should Barbie Follow Her Fund Manager to Another Firm?
July 20, 2023 July Charts of Interest: The Magnificent Seven
July 13, 2023 The SECURE Acts Make Roth IRAs More Attractive

Discussion
Barry from TX posted over 3 years ago:
Charles, the reinforcement tutorial on how to use earnings data is excellent. This week’s special question asking, “if AAII members thought other investors were too bullish or bearish right now” is, as Wayne, aka Dans Carvey, would say, “more excellent.” Combining a Goldilocks scale with a self-referential reflection format is as close to a Rorschach Test as we can get without using scatter plots to replace inkblots. You Chicago dudes know how to “party on.” Excellent!
Manju Sharma from CA posted over 3 years ago:
In the table of the Aug 10 article is displayed, there are two July 1st. Is it for 2023 and 2022. Estimated earnings growth was 9.3% last July (2022 July) and now it is 1.5%. May please know, how you pulled this data from SI Pro Thanks.
Charles Rotblut from Illinois posted over 3 years ago:
Manju,
The table above is from a Refinitiv report, not SI Pro.
-Charles
You need to log in as a registered AAII user before commenting.
Create an account