

July Charts of Interest: The Magnificent Seven
by Charles Rotblut | July 20, 2023
Featured Tickers: AAPL
AMZN
GOOGL
META
MSFT
NVDA
TSLA
AAPL
AMZN
GOOGL
META
MSFT
NVDA
TSLA
Just as soon as I got used to “MegaCap-8,” the lingo changed. The “Magnificent Seven” is now being used to describe this year’s market leaders. Those seven stocks are Alphabet Inc.  (GOOGL), Amazon.com Inc. (AMZN), Apple Inc. (AAPL), Meta Platforms Inc. (META), Microsoft Corp. (MSFT), Nvidia Corp. (NVDA) and Tesla Inc. (TSLA).
While I’m sure some of you think of the 1960 classic film when you hear the “Magnificent Seven,” I personally think of the 1981 song by The Clash. Anyway, I’m starting this month’s Charts of Interest with a few looks at the divergences that are occurring right now.
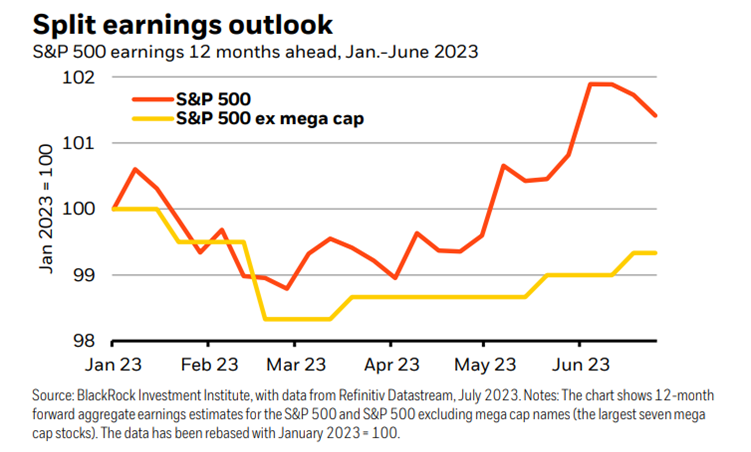
One example of this divergence is the chart below from BlackRock. The investment firm observed a difference between profit forecasts for mega-cap technology companies and the remainder of the S&P 500 index. The higher expected earnings growth for mega-cap tech stocks is referred to as “the artificial intelligence (AI) buzz.”
A Big Difference in Valuations
J.P. Morgan Asset Management calculated that the price-earnings (P/E) ratio of the 10 largest stocks in the S&P 500 was 29.3 at the end of June in its latest Guide to the Markets. This compares to 17.8 for the other 490 stocks. Seven of those top 10 stocks are tech oriented.
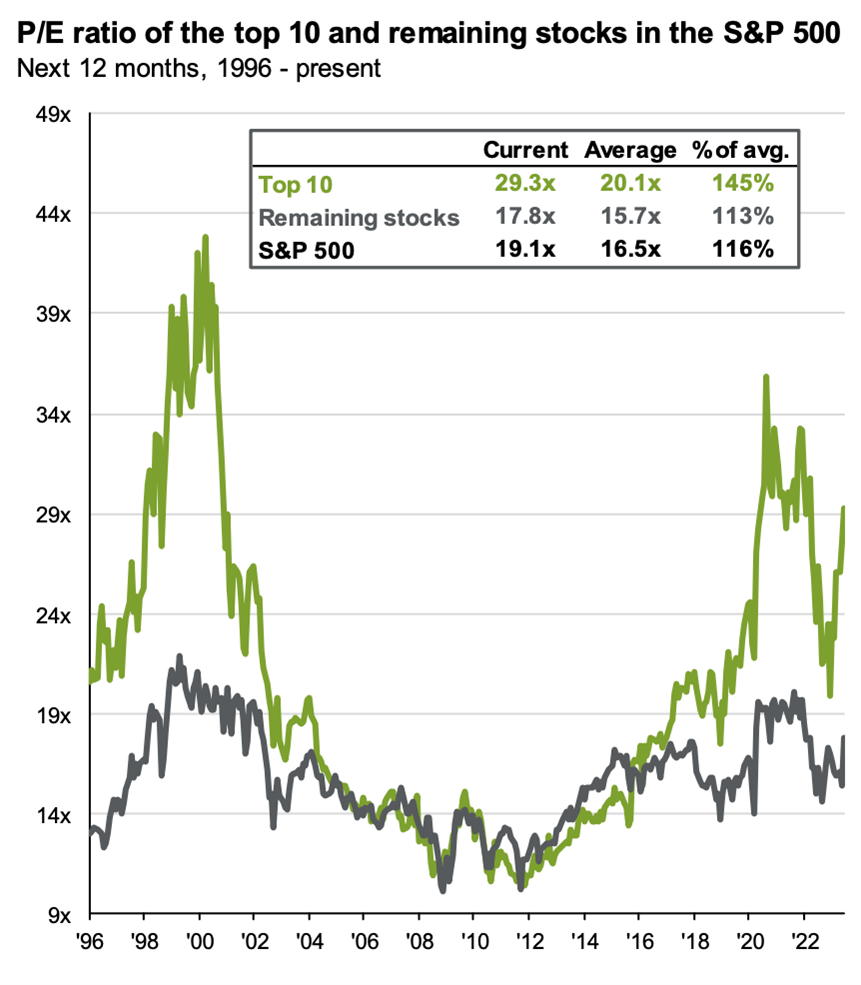
Source: J.P. Morgan Asset Management.
Even Buybacks Are Skewed
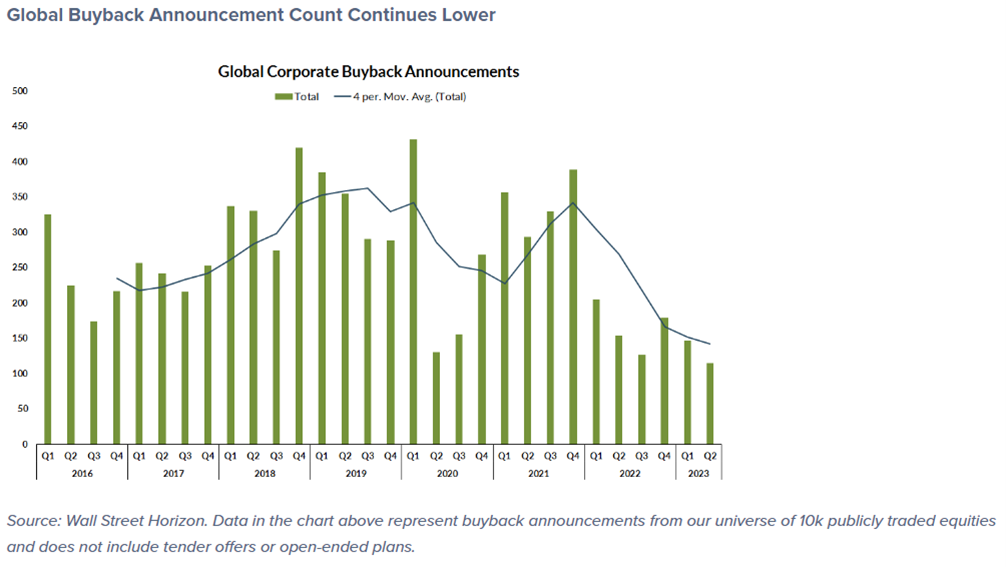
On the surface, buybacks are currently on pace with their record level reached in 2022. FactSet tabulates that more than $600 billion in share repurchase have been announced year to date. After digging deeper, they found that “among the 11 S&P 500 sectors, just two are responsible for the bulk of notional buybacks; Communication Services and Information Technology dominate.”
Attention Investors, We Have a Blue-Light Special on Small-Cap Stocks
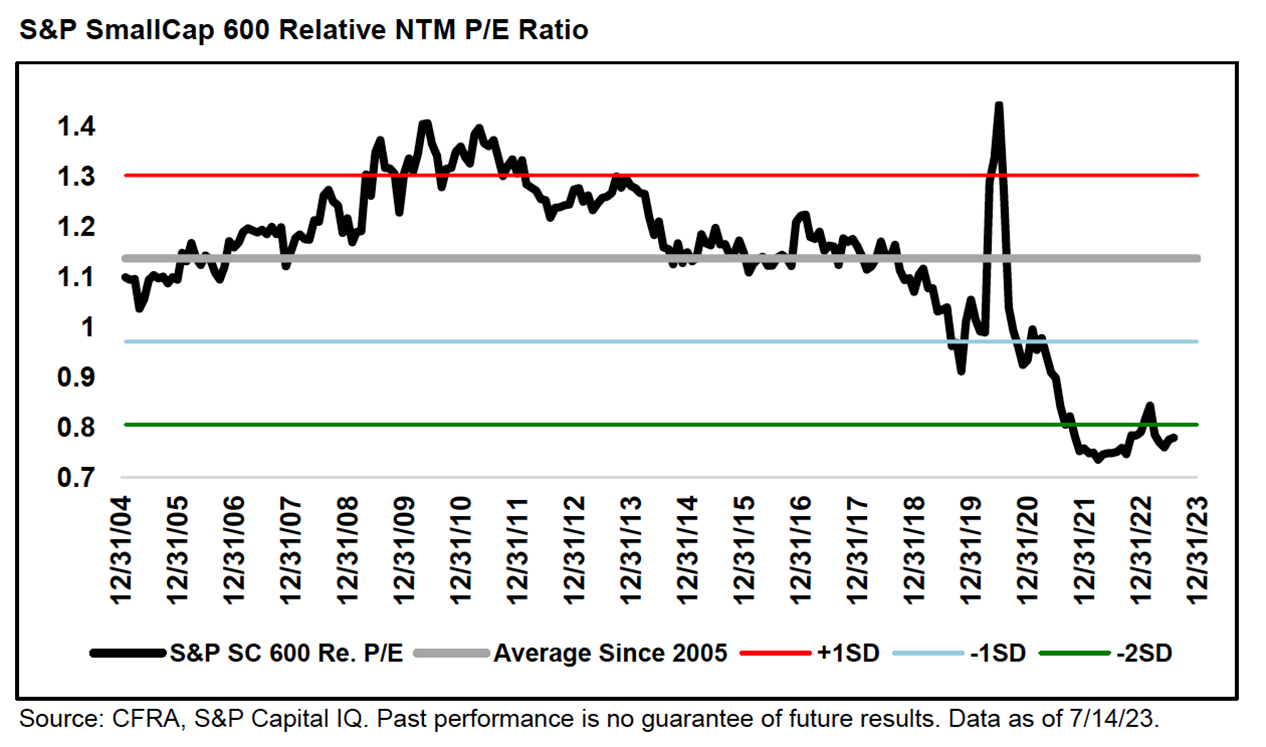
On Monday, CFRA Research’s chief investment strategist Sam Stovall noted that “the S&P SmallCap 600 was trading at a 31.5% discount to its historic relative forward 12-month [price-earnings ratio].” (This is labeled as “NTM,” or next 12 months, on the chart below.) Stovall describes the index’s forward price-earnings ratio as being “more than 2 standard deviations (SDs) below its average since 2005.”
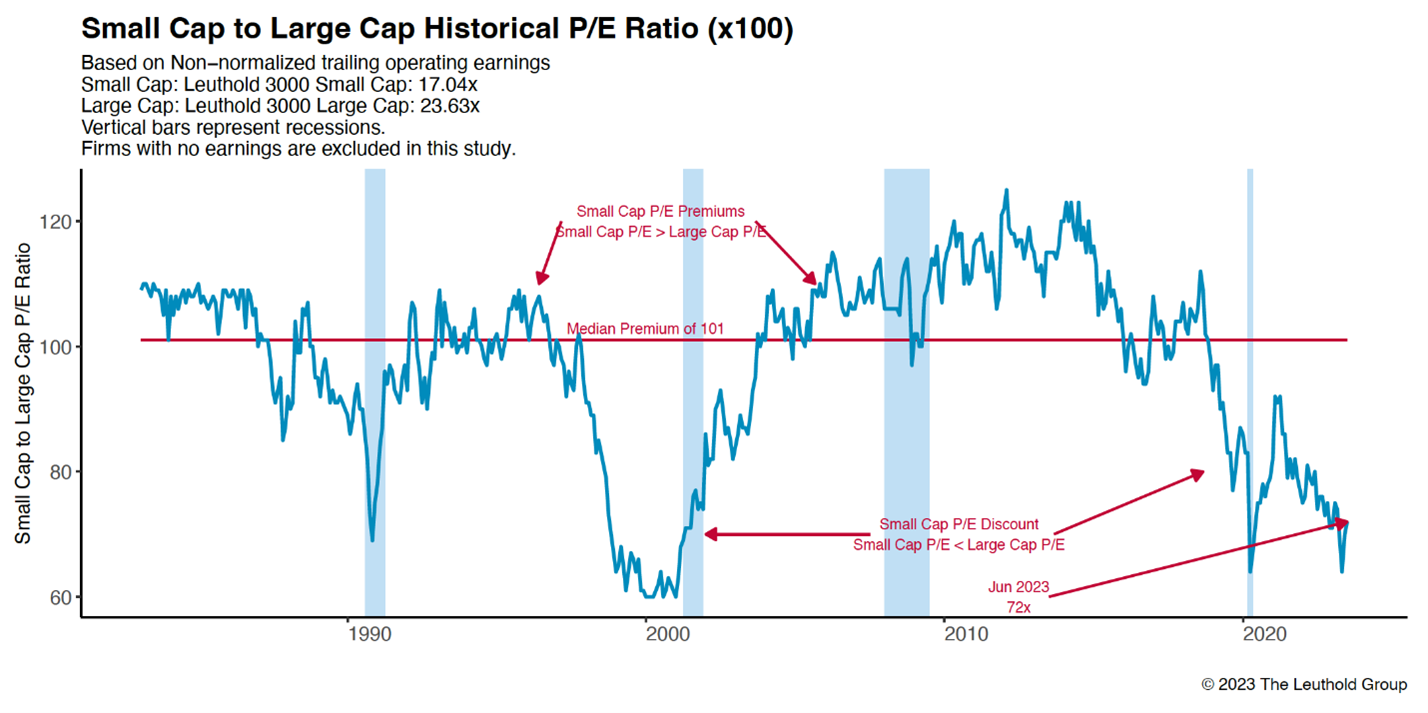
The Leuthold Group updated a similar chart showing that small-cap stocks remain historically cheap relative to large-cap stocks. The Leuthold Group’s analysis uses trailing earnings (instead of forward earnings) and its own large-cap and small-cap indexes.
Not Going to Be Cheap to Refinance
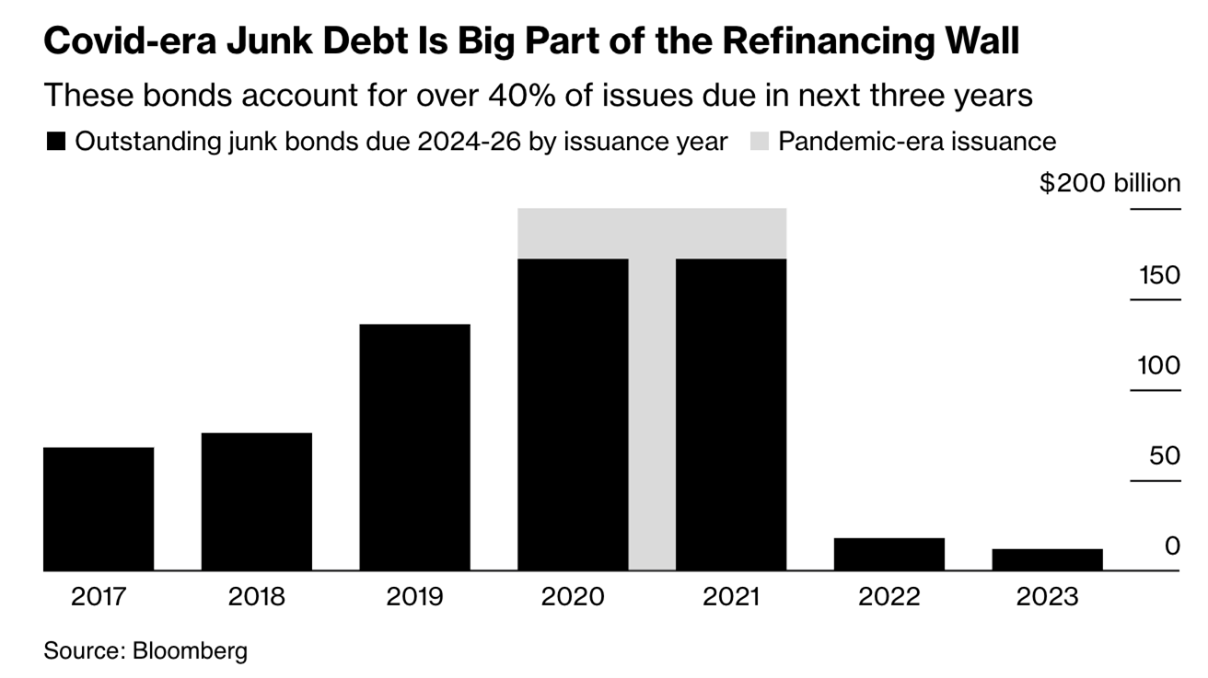
Bloomberg estimates that more than 40% of junk bond debt that will need to be refinanced between 2024 and 2026 was taken on during the coronavirus pandemic. Not only have interest rates soared since then—as you well know—but so have refinancing costs. Bloomberg says companies are having to pay an additional 3% to replace their debt. This is “more than five times the average since 2018.”

-
Incorporating the Price-Earnings Ratio Into Your Screening and Analysis
The price-earnings ratio is widely used as a valuation metric because of its simplicity. It embodies the market’s expectation of future company performance and relates it to actual, recent company performance. -
Stock Buybacks: Misunderstood, Misanalyzed and Misdiagnosed
The benefit or harm of a stock buyback is dependent on several factors, including how it is funded and the alternative uses for the cash. -
Five Steps for Conducting a Midyear Portfolio Review
A midyear review is useful for ensuring your portfolio remains on track to achieve your financial goals. How to go about it. -
Auto & Truck Stocks Shift Into High Gear
Despite the recent negative headwinds for the auto and truck manufacturing industry, there are reasons for optimism going forward. -
Budget Status: It’s Complicated
In her latest My Investing Discoveries blog post, find out how Anine Sus factors recent hikes in fixed expenses into her budget.
Members are looking for your input. Can you help with this question from the Global Market Investing Community?
“The article, ‘Going Global: Mutual Funds and ETFs Targeting Regions and Countries,’ discusses the impact of fluctuating exchange rates on the value of an investment, even if the security’s price remains unchanged in its home currency. Do you gain exposure to foreign markets through international funds or by owning shares in large multinational corporations?”
Tap the button and then choose the Join the Community button on the right to answer this question in the AAII Community
Answer This Question in the AAII Community »
AAII Sentiment Survey
Optimism increased and reached an unusually high level in the latest AAII Sentiment Survey. Neutral sentiment and bullish sentiment both decreased.
Bullish sentiment, expectations that stock prices will rise over the next six months, jumped 10.4 percentage points to 51.4%. This marks the seventh consecutive week that bullish sentiment is above its historical average of 37.5%. This has been the longest above-average streak since a 13-week stretch from February to May 2021. Bullish sentiment was last higher on April 22, 2021 (52.7%) and is currently at an unusually high level.
Neutral sentiment, expectations that stock prices will stay essentially unchanged over the next six months, plunged 6.0 percentage points to 27.1%. Neutral sentiment is below its historical average of 31.5% for the fifth time in 10 weeks.
Bearish sentiment, expectations that stock prices will fall over the next six months, decreased 4.4 percentage points to 21.5%. At seven consecutive weeks, this is the longest pessimism has been below average since a 23-week streak from February to July 2021. Bearish sentiment is at its lowest level since June 10, 2021 (20.7%) and is nearing the bottom of its typical range.
The bull-bear spread (bullish minus bearish sentiment) shot up 14.7 percentage points to 29.9%. The bull-bear spread has reached an unusually high level.
This week’s special question asked AAII members about their thoughts on small-cap stocks still being in a bear market. Here are the responses:
- Keeps small-cap stocks attractively valued: 34.4%
- The lack of market breadth is concerning: 31.5%
- Doesn’t concern me/I focus on large-cap stocks: 14.3%
- Other/not sure: 19.4%
Bullish: 51.4%, up 10.4 points
Neutral: 27.1%, down 6.0 points
Bearish: 21.5%, down 4.4 points
Bullish: 37.5%
Neutral: 31.5%
Bearish: 31.0%
See more Sentiment Survey results.

July 13, 2023 The SECURE Acts Make Roth IRAs More Attractive
July 6, 2023 The State of the U.S. Financial Markets as of Midyear 2023
June 29, 2023 Harry Markowitz's Lasting Influence on Investing
June 22, 2023 June Charts of Interest: Are Happy Days Here Again?

Discussion
DENNIS BARNES from ca posted over 3 years ago:
"On Monday, CFRA Research’s chief investment strategist Sam Stovall noted that 'the S&P SmallCap 600 was trading at a 31.5% discount to its historic relative forward 12-month [price-earnings ratio].'" Everyone is making a huge mistake in looking at PEs relative to the S&P 500, since the S&P 500 price-earning ratio is badly skewed by the, as it's called here, "the Magnificent Seven". Removing those 7 outliers reduces the composite PE ratio of the remaining S&P 500 stocks, to provide a much more reasonable comparison.
Barry from TX posted over 3 years ago:
Kudos Charles on trying to get AAII “long-term” investors to focus on some of the significant gaps in the financial logic underlying markets in 2023. Maybe these observations will help. Going back into history, you would have found the same degree of divergency cataloged in this article between the large-cap “haves” and small-caps “have nots” as there were between the first-class and steerage passengers on the Titanic. We know what happened to everyone next. Markets sailing smoothly into dangerous waters have been known to “sink” too. First only 15 years after that infamous vessel and 11 times since 1945 with increasing frequency and magnitude since 2000. In 1999, the “internet buzz” was sailing along and thought to be unsinkable … until they weren’t. In 2023, “the AI buzz” is sailing along … but has yet to bring its investor passengers into a safe harbor. Why does Kathy Woods’ ARK story seem to fit in here as another obvious cautionary tale right before our eyes? And another shoutout to Charles for giving The Clash some props. They fit right into the overall themes in this article. When the Clash came to the US in 1981, they tanked faster than the Titanic. Silver lining -- those unloved, undervalued small caps may be the lifeboats that save us AAII steerage class investors when the time comes.
Charles Rotblut from Illinois posted over 3 years ago:
Barry,
Not only is The Clash one of my favorite bands, they are the only band that matters. :)
You need to log in as a registered AAII user before commenting.
Create an account